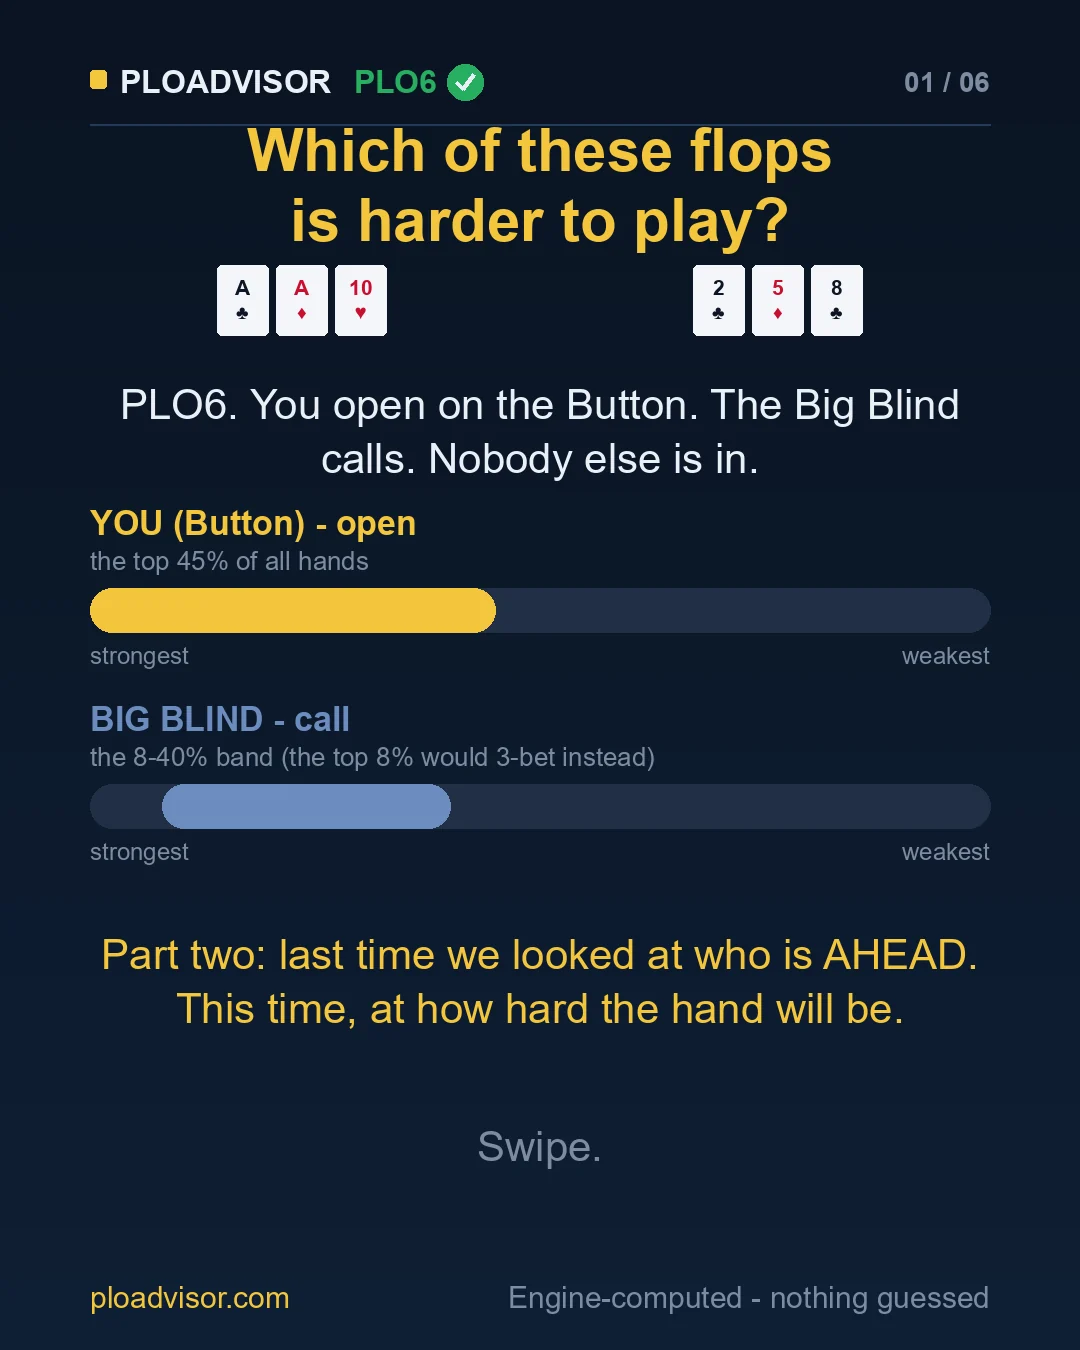
Same PLO6 spot, two flops. On A♣ A♦ 10♥ almost nothing sits in the middle of either player’s range; on 8♣ 5♦ 2♣ the middle is where almost everything lives. And on each flop the two players share the same shape: across all 1,755 flops we computed, 71% give the Button and the Big Blind a middle band within 8 points of each other. The shape of the equity curve belongs to the board.
Key numbers
- Spot: PLO6, Button opens the top 45%, Big Blind calls with the 8–40% band, nobody else in. Only the flop changes.
- Middle band (hands between 45% and 60% equity) on A♣ A♦ 10♥: Button 3.7% · Big Blind 2.9%.
- On 8♣ 5♦ 2♣: Button 66% · Big Blind 58%.
- Across all 1,755 flops, 71% give both players a middle band within 8 points of each other.
The spot
The same spot as part one: heads-up, single-raised pot. The Button opens the top 45% of all PLO6 hands; the Big Blind calls with the 8–40% band (the top 8% would re-raise instead). Each range is cut from our playability ranking. Part one looked at the tail of the curve — who holds the nuts. This part looks at the middle.
Same range, two flops
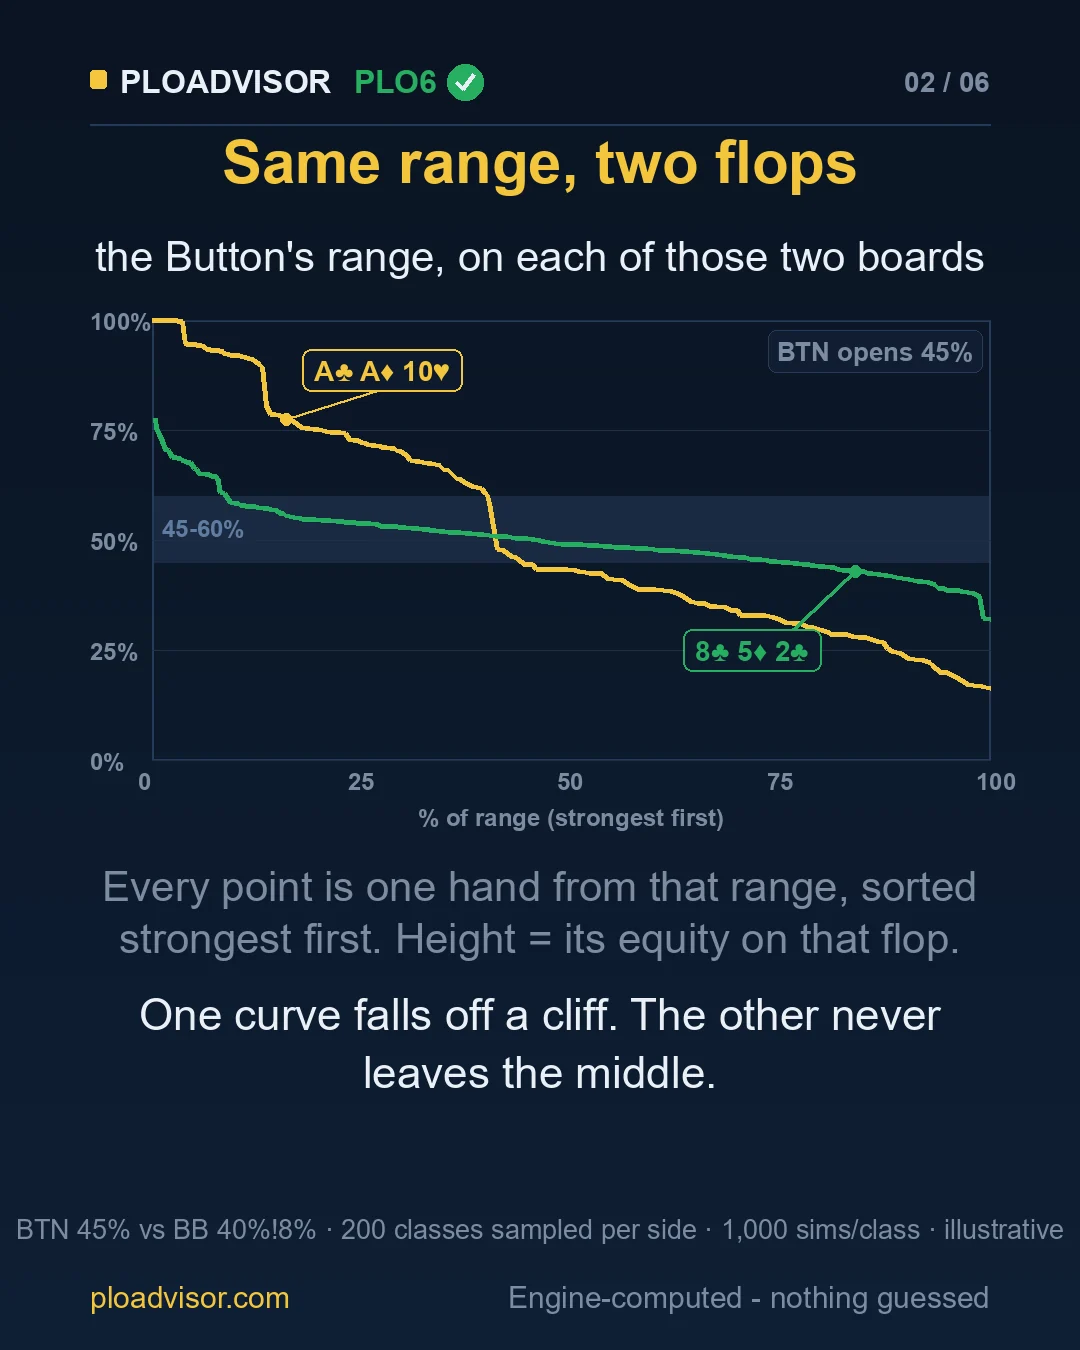
Here the curve is one player — the Button — on two different flops. Every point is one hand class from the range, sorted strongest first; its height is the hand’s equity on that flop. One curve falls off a cliff. The other never leaves the middle.
To put a number on it, take the middle band: the share of a range whose equity on the flop is between 45% and 60%.
Hollow in the middle
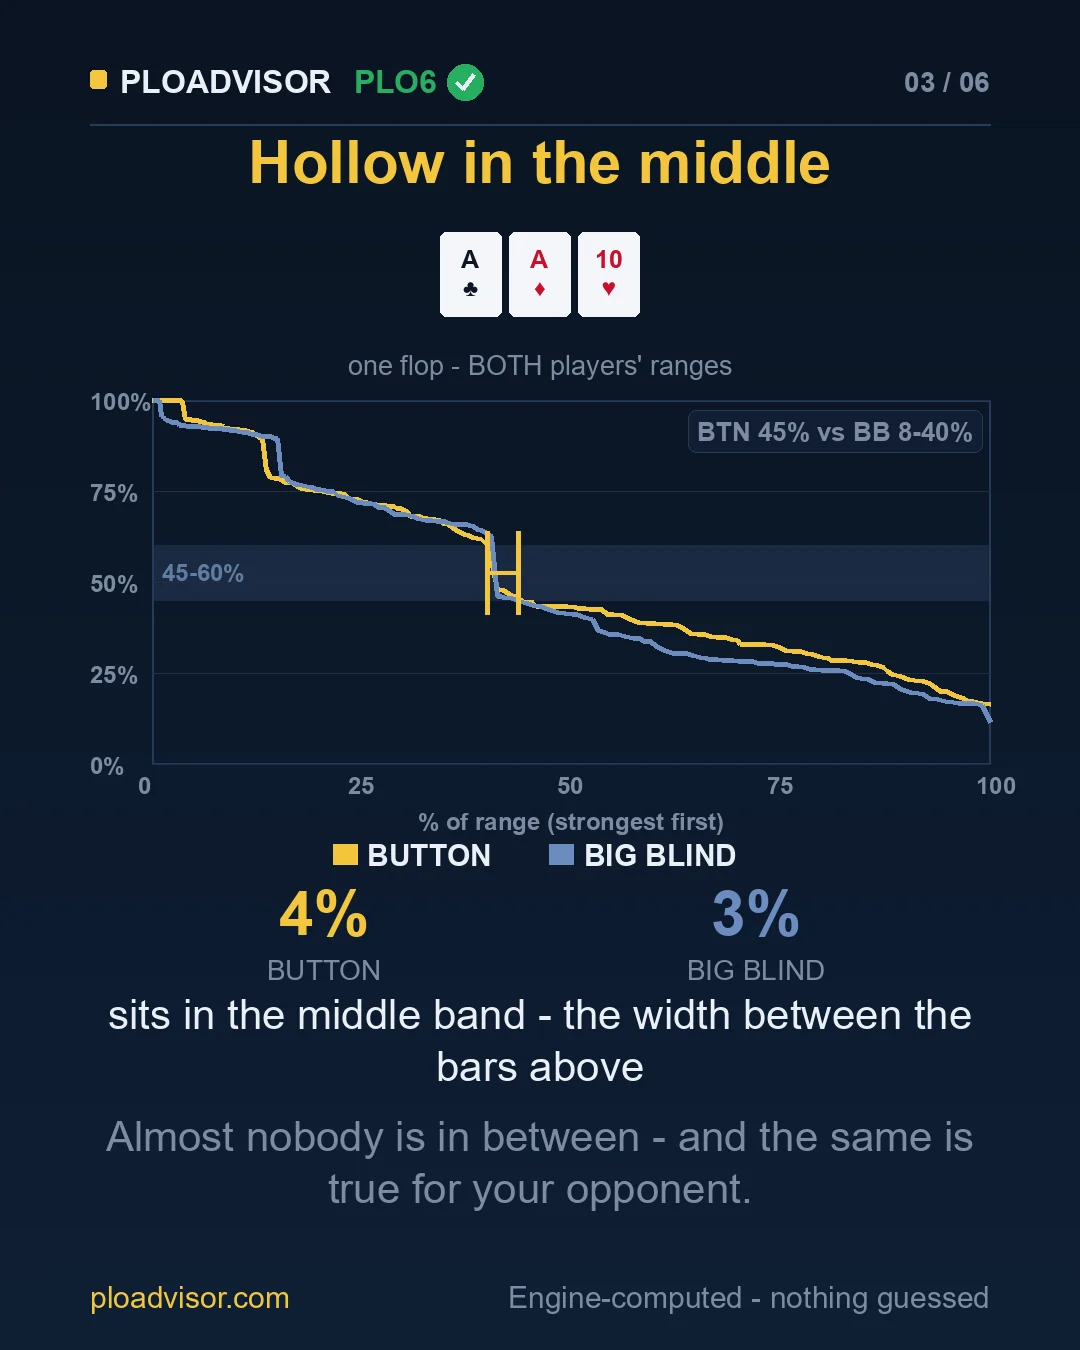
On A♣ A♦ 10♥, 3.7% of the Button’s range and 2.9% of the Big Blind’s sit in the middle band. Almost nobody, on either side, is in between. Most hands answer themselves: clearly ahead or clearly behind.
Fat in the middle
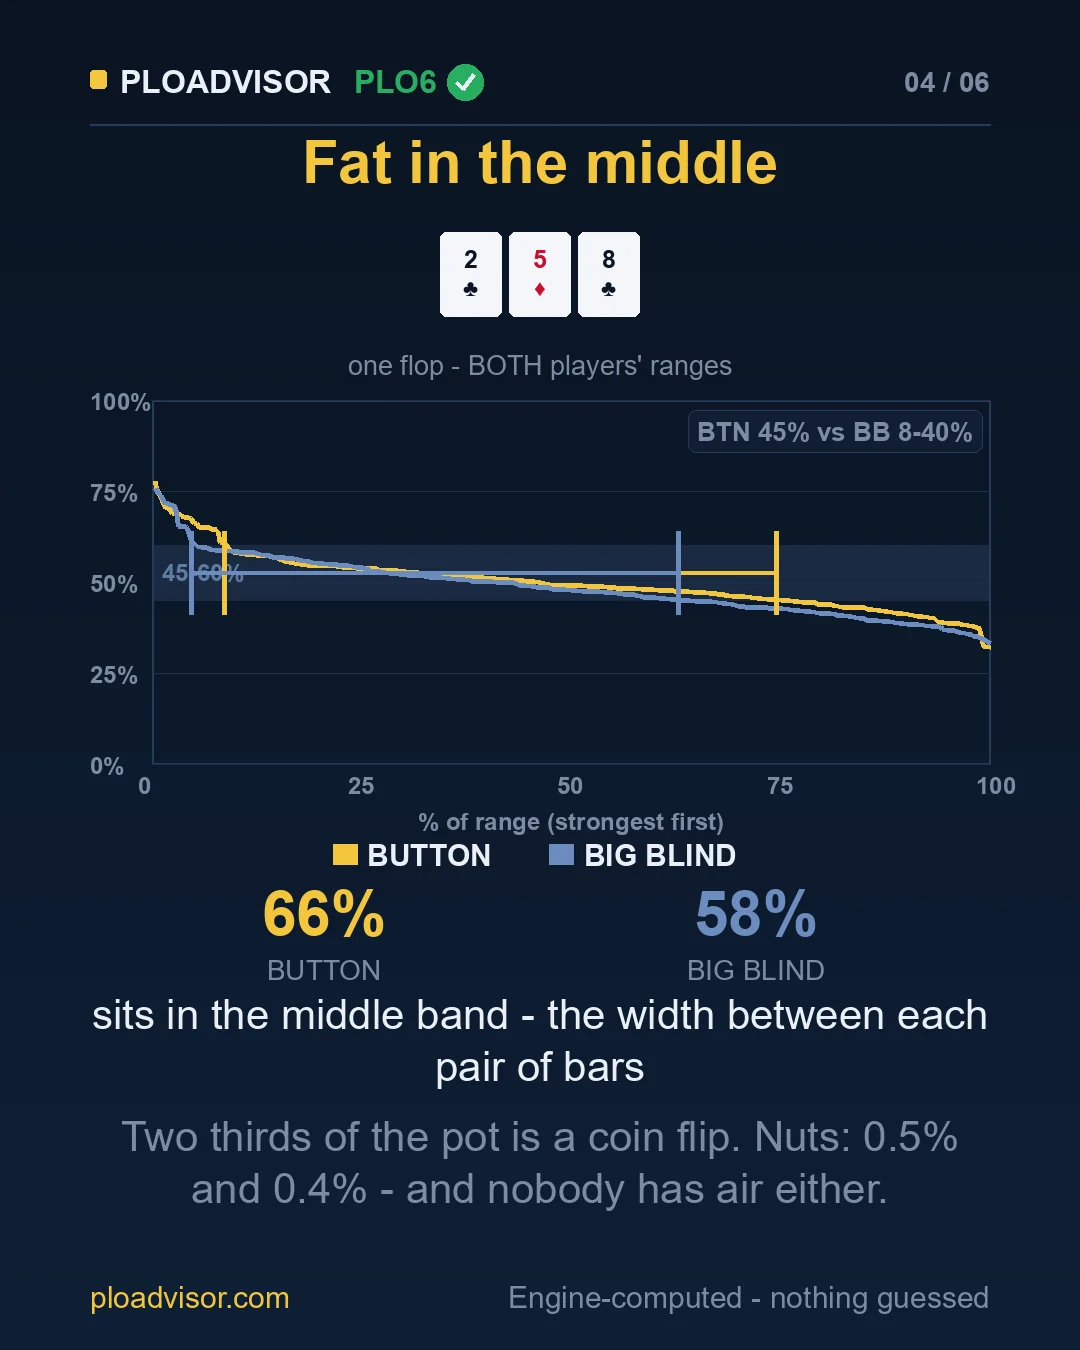
On 8♣ 5♦ 2♣ it is the reverse: 66% and 58% of the two ranges sit in the middle band — about two thirds of the Button’s range is a close call. Nobody has the nuts (0.5% and 0.4% of each range above the 75% nut line) and nobody has nothing.
| Flop | Shape | Button in the middle band | Big Blind in the middle band |
|---|---|---|---|
| A♣ A♦ 10♥ | Hollow | 3.7% | 2.9% |
| 8♣ 5♦ 2♣ | Fat | 66% | 58% |
The shape belongs to the board
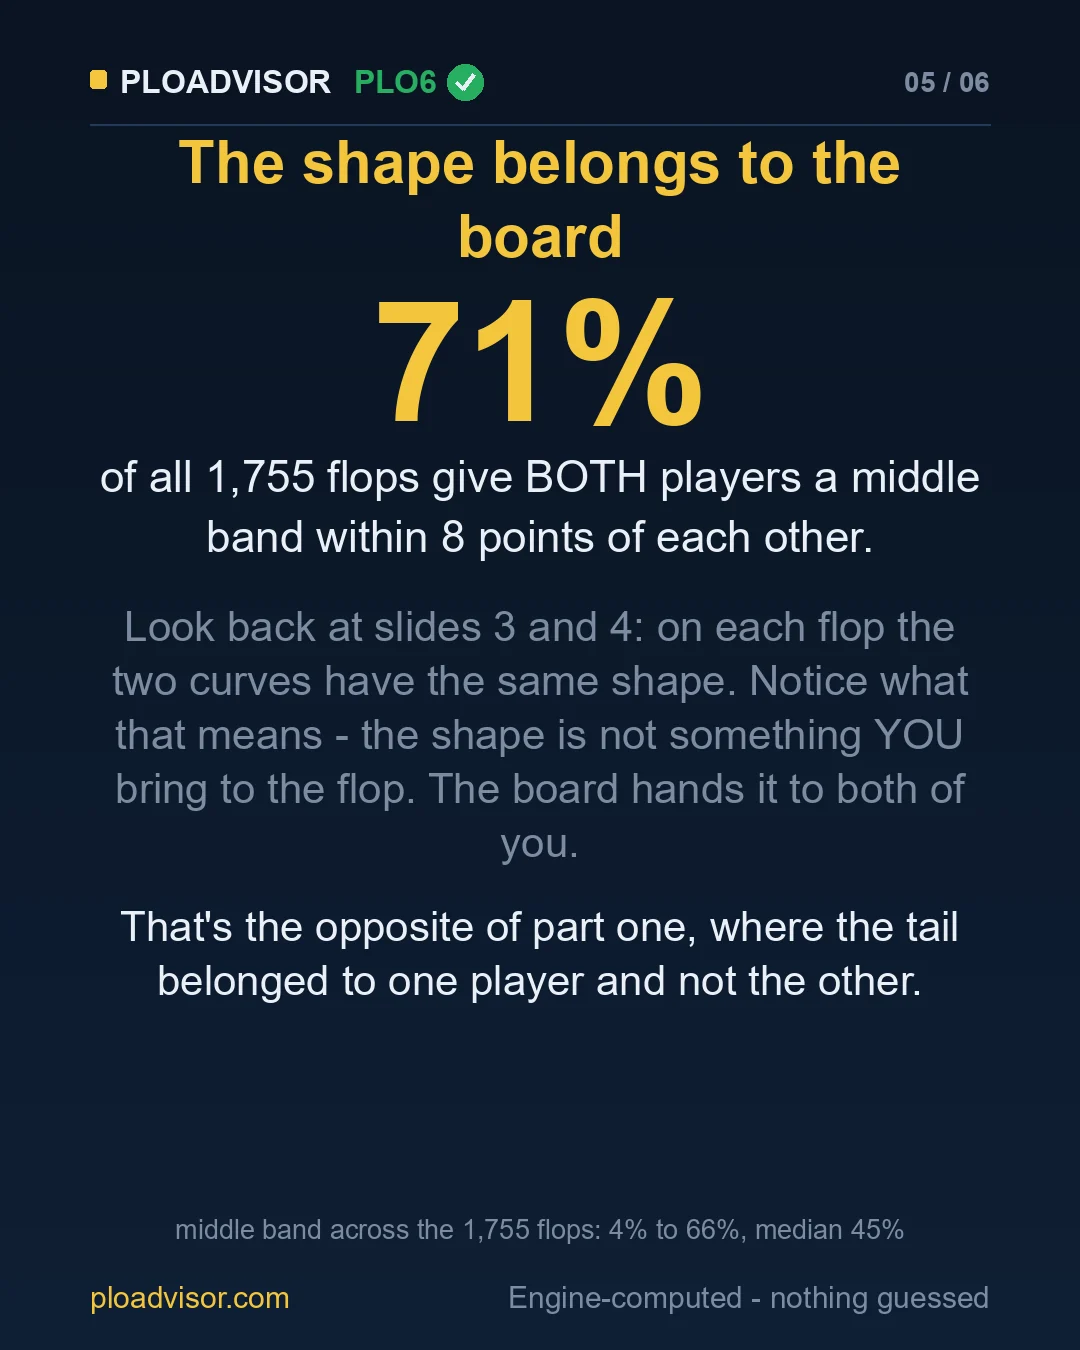
Look at the two flops again: on each one, the two players’ curves have the same shape. That is not a coincidence. Across all 1,755 flops we computed, 71% give both players a middle band within 8 points of each other. The shape is not something a player brings to the flop — the board hands it to both. That is the opposite of part one, where the tail belonged to one player and not the other.
For scale: the Button’s middle band ranges from 4% to 66% across those flops, with a median of 45%. The two flops above are the two ends of that range.
The 71% is measured on sampled hand classes (see below). Sampling noise in each side’s middle band tends to push the two measurements apart rather than together, so if anything the true share of “same shape” flops is higher than the figure shown.
What it means at the table
The two halves of the curve answer different questions. The tail: who is winning. The middle: how hard the hand is going to be to play. On a hollow flop most hands answer themselves. On a fat one, about two thirds of the range is a close call — and close calls are where the money goes. This page describes the character of the decision, not how much to bet.
How these numbers were produced
- Ranges: a calibrated reference spot — Button opens the top 45%, Big Blind calls the 8–40% band — cut from our PLO6 playability ranking (how we built it).
- Simulated and sampled: pre-computed equity distributions for each of the 1,755 strategically distinct flops, with 200 hand classes sampled per side and 1,000 simulations per class. Each class counts by the number of concrete hands it stands for.
- Middle band: the share of a range with equity between 45% and 60% on the flop. “Same shape” means the two players’ middle bands are less than 8 points apart.
- Illustrative: the numbers for a single flop teach the shape, not the decimal.