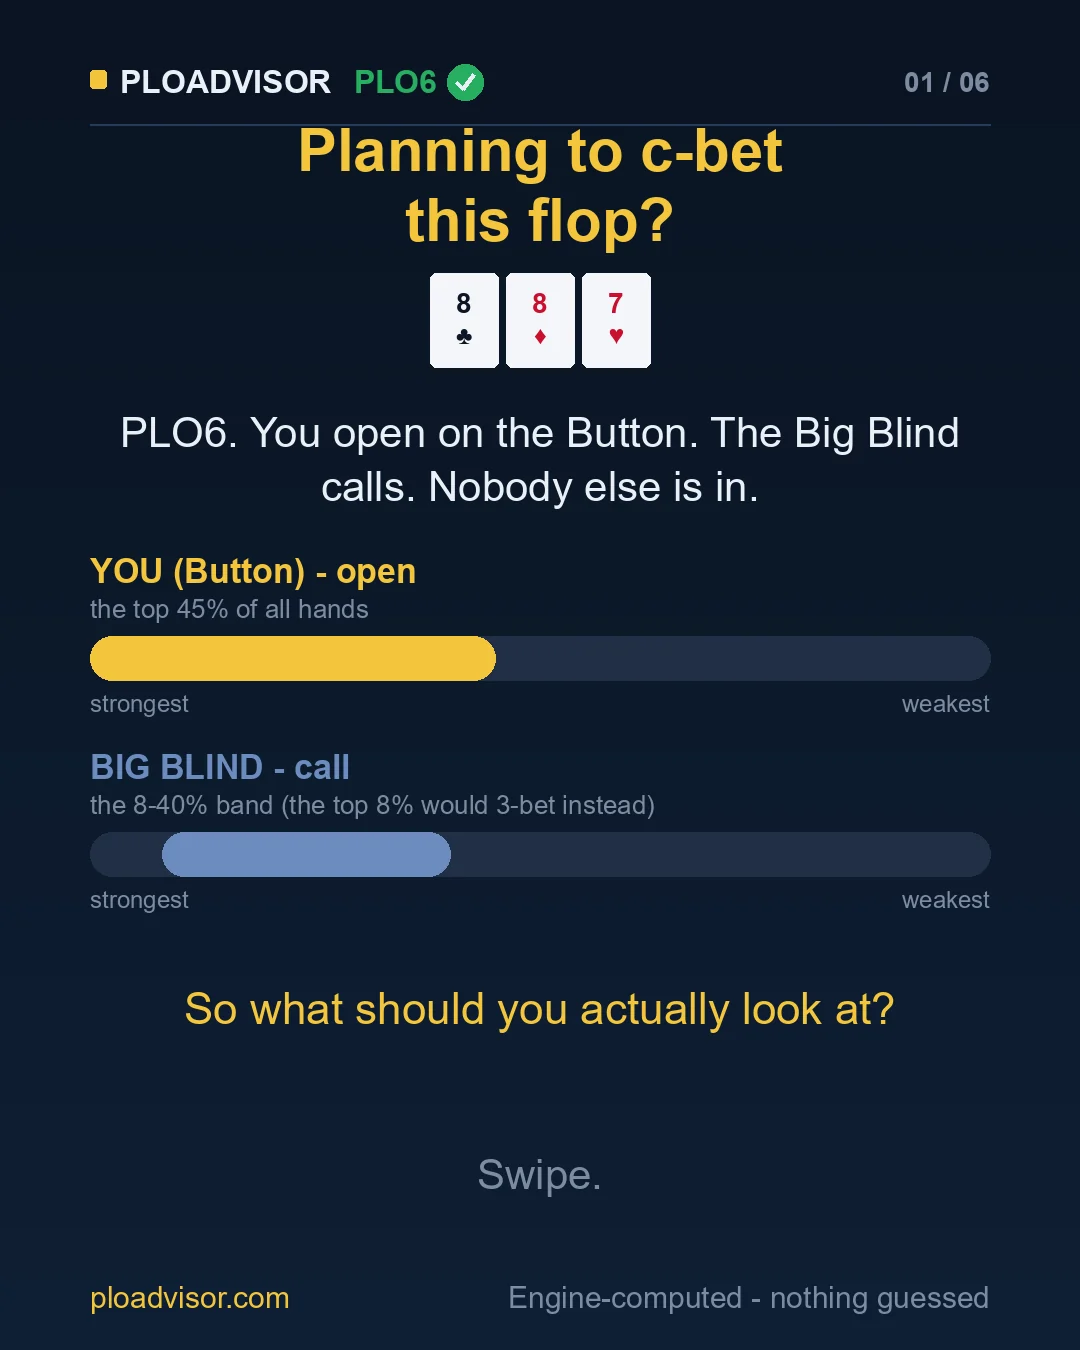
In PLO6 (six-card Pot-Limit Omaha), you open on the Button and the Big Blind calls. The flop comes 8♣ 8♦ 7♥. On average the two ranges are within a couple of points of each other — that number does not separate anyone. The top of the equity curve does: 10% of the Button’s range sits above the nut line, against 22% of the Big Blind’s. The player who called holds about 2.1 times the nutted hands.
Key numbers
- Spot: PLO6, Button opens the top 45%, Big Blind calls with the 8–40% band, nobody else in.
- On 8♣ 8♦ 7♥, hands above 75% equity: Button 10% · Big Blind 22%.
- Same spot, same two ranges, flop 2♣ 2♦ 2♥: Button 36% · Big Blind 14% — the tail flips sides.
- The average equity of the two ranges on 8♣ 8♦ 7♥ is within a couple of points: inside the precision of the measurement, and no help in telling the players apart.
The spot
Heads-up, single-raised pot, PLO6. Each range is a slice of all hand classes, ordered by our playability ranking:
| Player | Action | Range |
|---|---|---|
| You — Button | Open | the top 45% of all hands |
| Big Blind | Call | the 8–40% band (the top 8% would 3-bet instead) |
The Big Blind’s range starts at 8% rather than at the top: the strongest hands would have re-raised before the flop, so they are not among the hands that just called.
Both ranges on this flop
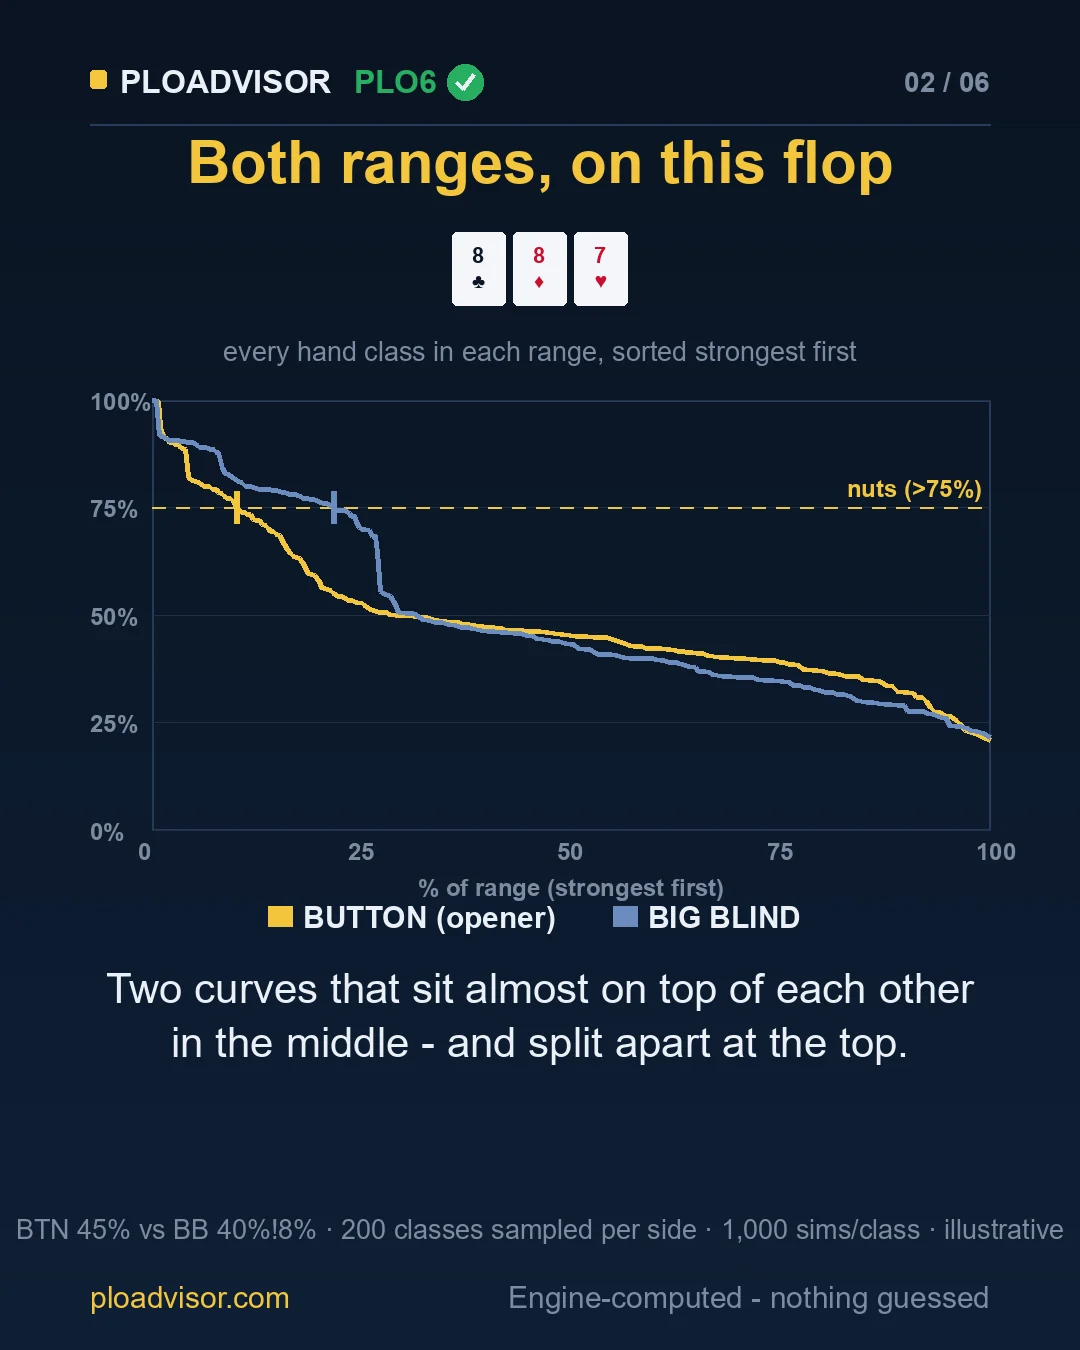
This is an equity distribution: every hand class in each player’s range, sorted strongest first, each drawn at its equity against the other range on this exact flop. The two curves sit almost on top of each other in the middle — and split apart at the top.
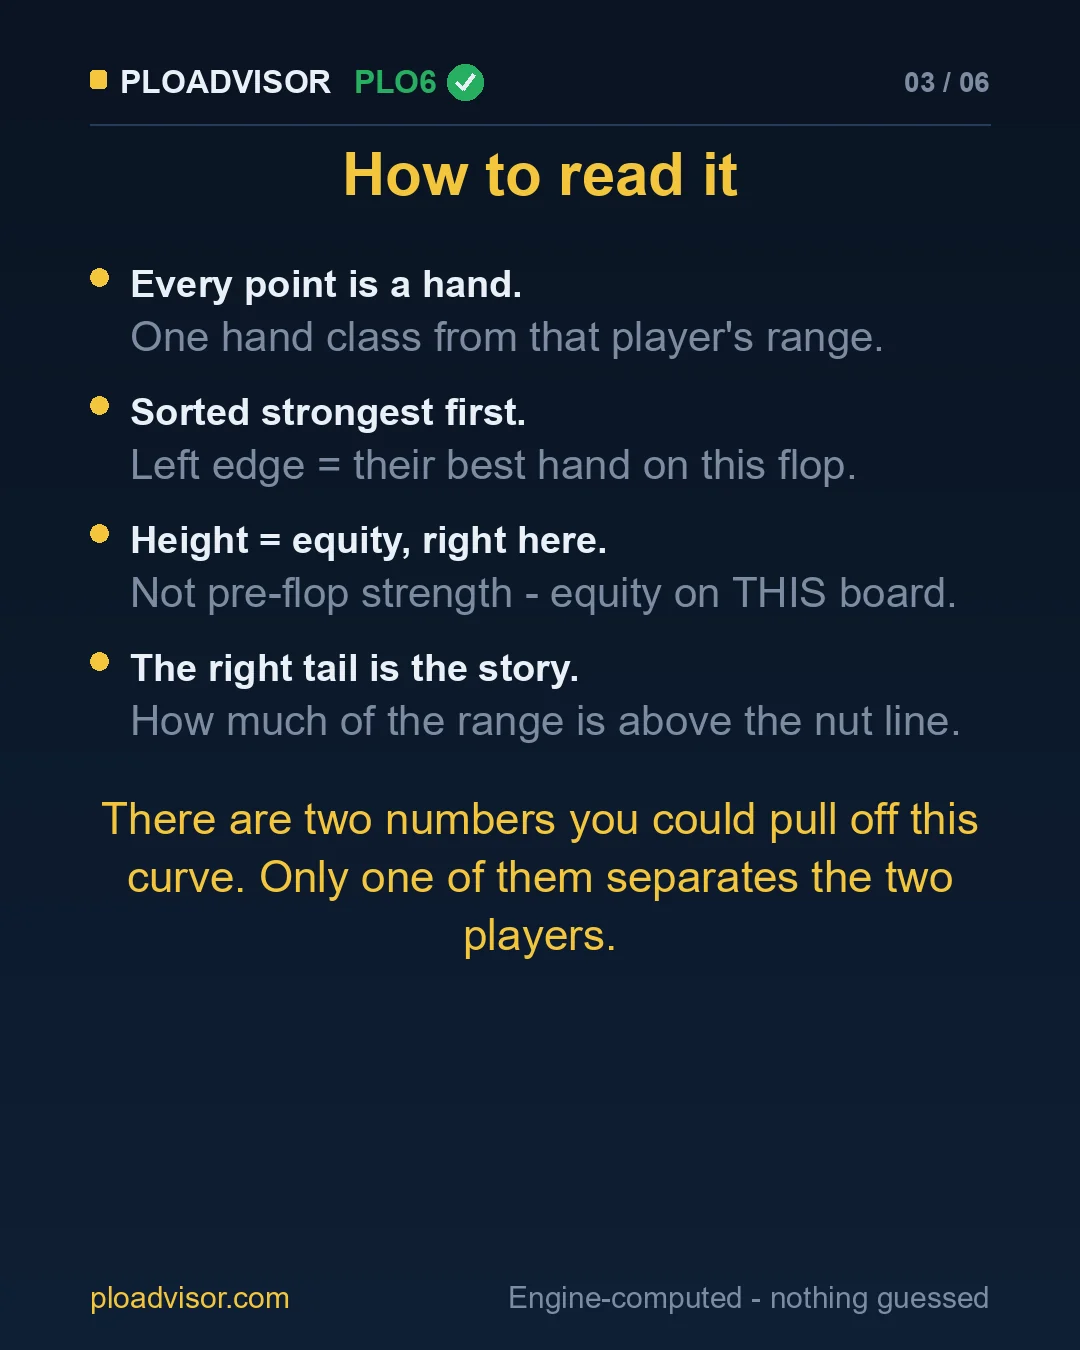
Four things to read on it:
- Every point is a hand — one hand class from that player’s range.
- Sorted strongest first — the left edge is that player’s best hand on this flop.
- Height is equity, right here — not pre-flop strength, but equity on this board.
- The right tail is the story — how much of the range sits above the nut line at 75% equity.
Two numbers you could pull off the curve
The average equity. On 8♣ 8♦ 7♥ the two averages are within a couple of points of each other, which is inside the precision of our measurement. It says the pot is close to even. It does not say who has something worth building a pot with.
The share above the nut line. This one separates the two players, and by a lot:
| Flop | Button | Big Blind | More nutted hands |
|---|---|---|---|
| 8♣ 8♦ 7♥ | 10% | 22% | Big Blind, about 2.1× |
| 2♣ 2♦ 2♥ | 36% | 14% | Button, about 2.5× |
A note on the averages. The social version of this post printed the two average equities for this flop to one decimal. A later check of our equity distributions showed that an average taken from them carries an error of a couple of points on each side — enough that, here, a re-measurement put the two averages in the opposite order. What the post said about them still holds: they are close, and they do not separate the players. That is why this page does not print them. The share above the nut line is a different quantity, and we checked it separately: the gap between the two players stands clear of the sampling noise.
Now the mirror
Keep the spot and the two ranges exactly as they were, and change only the flop, to 2♣ 2♦ 2♥.
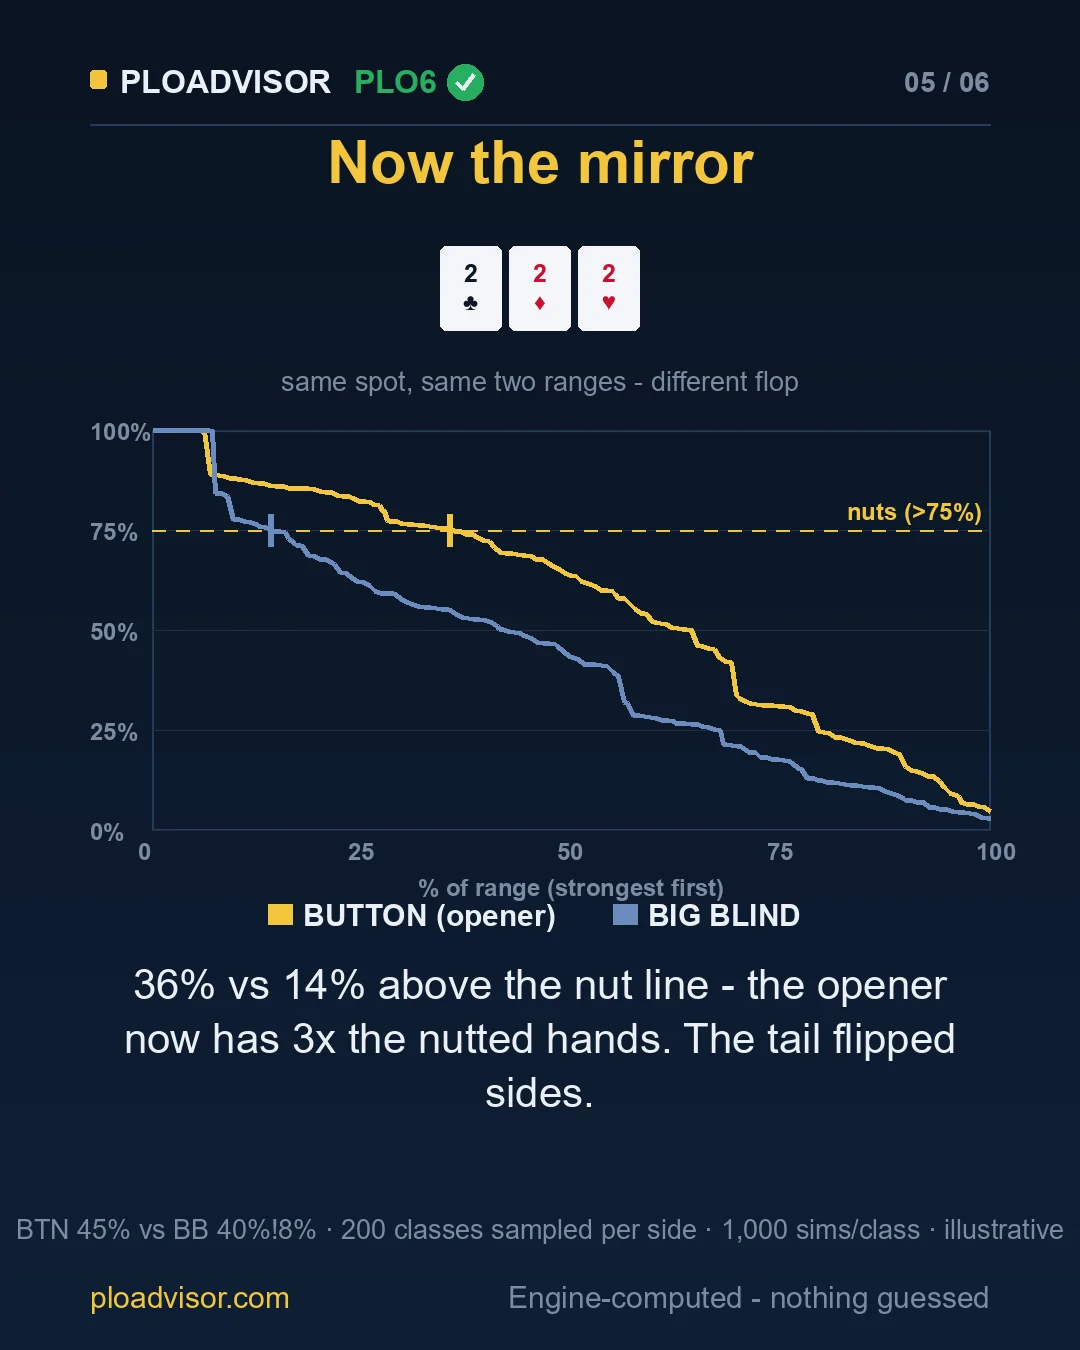
Now it is the opener who holds the nutted hands: 36% of the Button’s range is above the nut line, against 14% of the Big Blind’s — about 2.5 times as many. The tail changed sides.
What it means at the table
Same spot, same two ranges, two flops: on one the caller holds about 2.1 times the opener’s nutted hands, on the other the opener holds about 2.5 times the caller’s. That is the number that changed — and it changed completely. The average tells you whether the pot is close to even; the right tail tells you who has something worth building a pot with. This page is about where to look on the curve, not about how often to bet.
How these numbers were produced
- Ranges: a calibrated reference spot — Button opens the top 45%, Big Blind calls the 8–40% band — cut from our PLO6 playability ranking (how we built it).
- Simulated and sampled: pre-computed equity distributions with 200 hand classes sampled per side and 1,000 simulations per class. Each class counts by the number of concrete hands it stands for, so the curve and the shares above describe the range, not a list of classes.
- The flops: chosen from a scan of all 1,755 strategically distinct flops — picked to show the effect clearly. The results for a single flop are illustrative: the lesson is the tail, not the decimal.
- Nut line: a fixed equity level of 75%. The share of a range above it is what this page calls its nutted part.