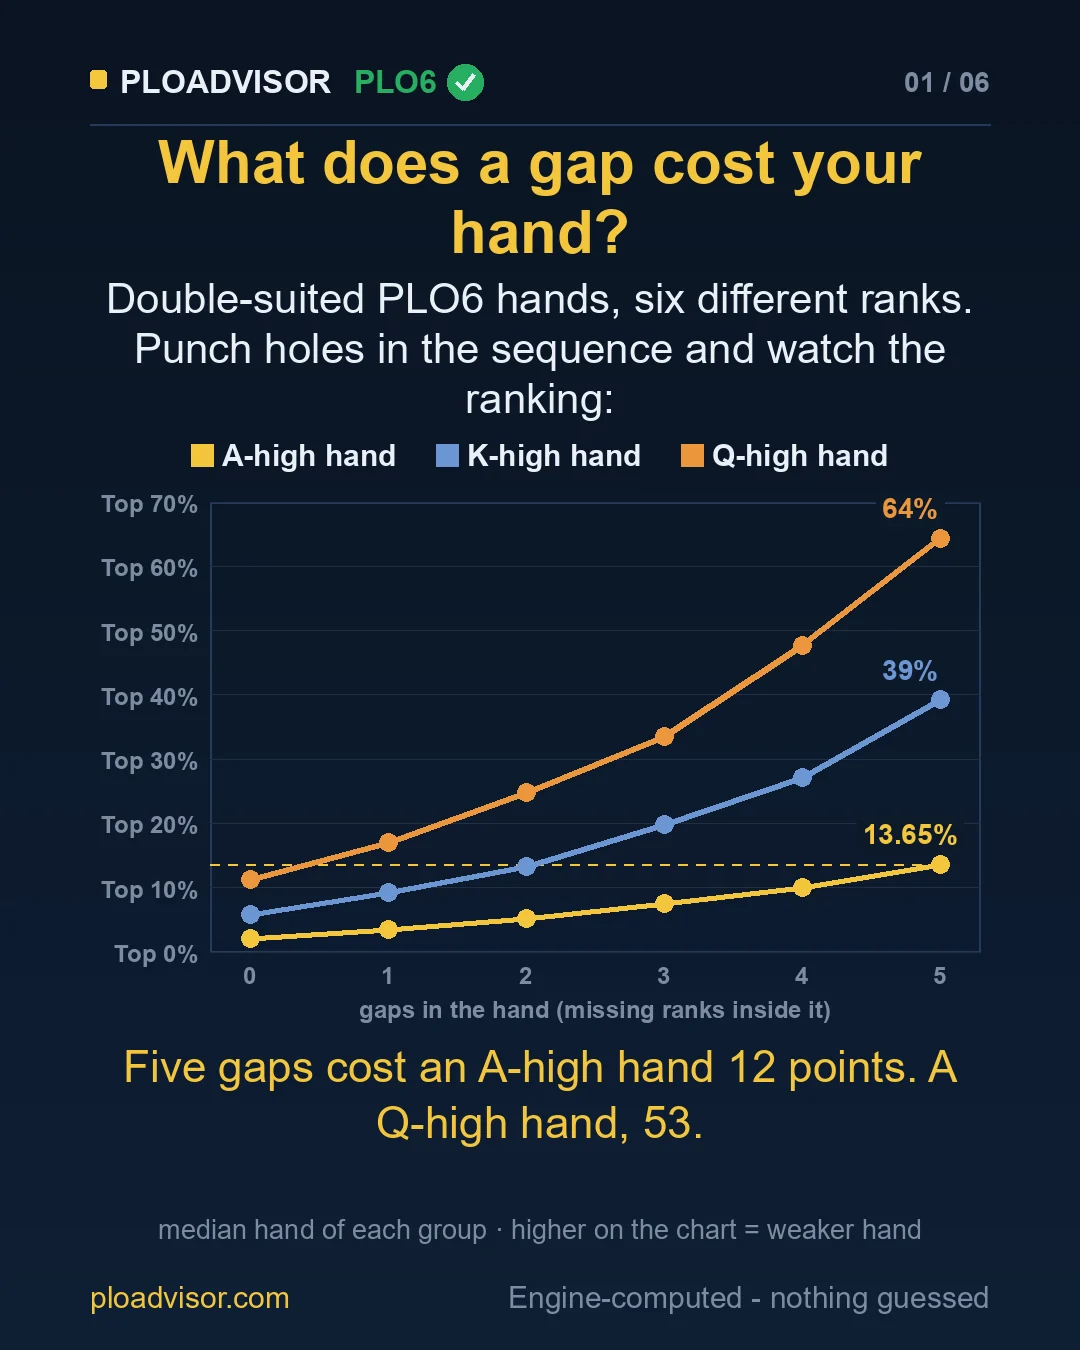
In PLO6 (six-card Pot-Limit Omaha), a gap in your hand has no fixed price. Take the typical double-suited hand and punch five holes in its sequence: an A-high hand slides from Top 2.12% to Top 13.65% — about 12 percentile points. A K-high hand falls about 33 points; a Q-high hand, about 53.
Key numbers
- Measured over all 7,028,736 PLO6 hands with six different ranks — no hand picked by us. Each number is the median hand of its group.
- The first gap costs an A-high hand 1.4 points, a K-high hand 3.4, a Q-high hand 5.7.
- More suits make gaps cheaper: five gaps cost a triple-suited A-high hand 4 points, and one with three cards of one suit 30.
- The typical double-suited A-high hand with four gaps ranks next to a perfect Q-high rundown.
What a gap is, and what we counted
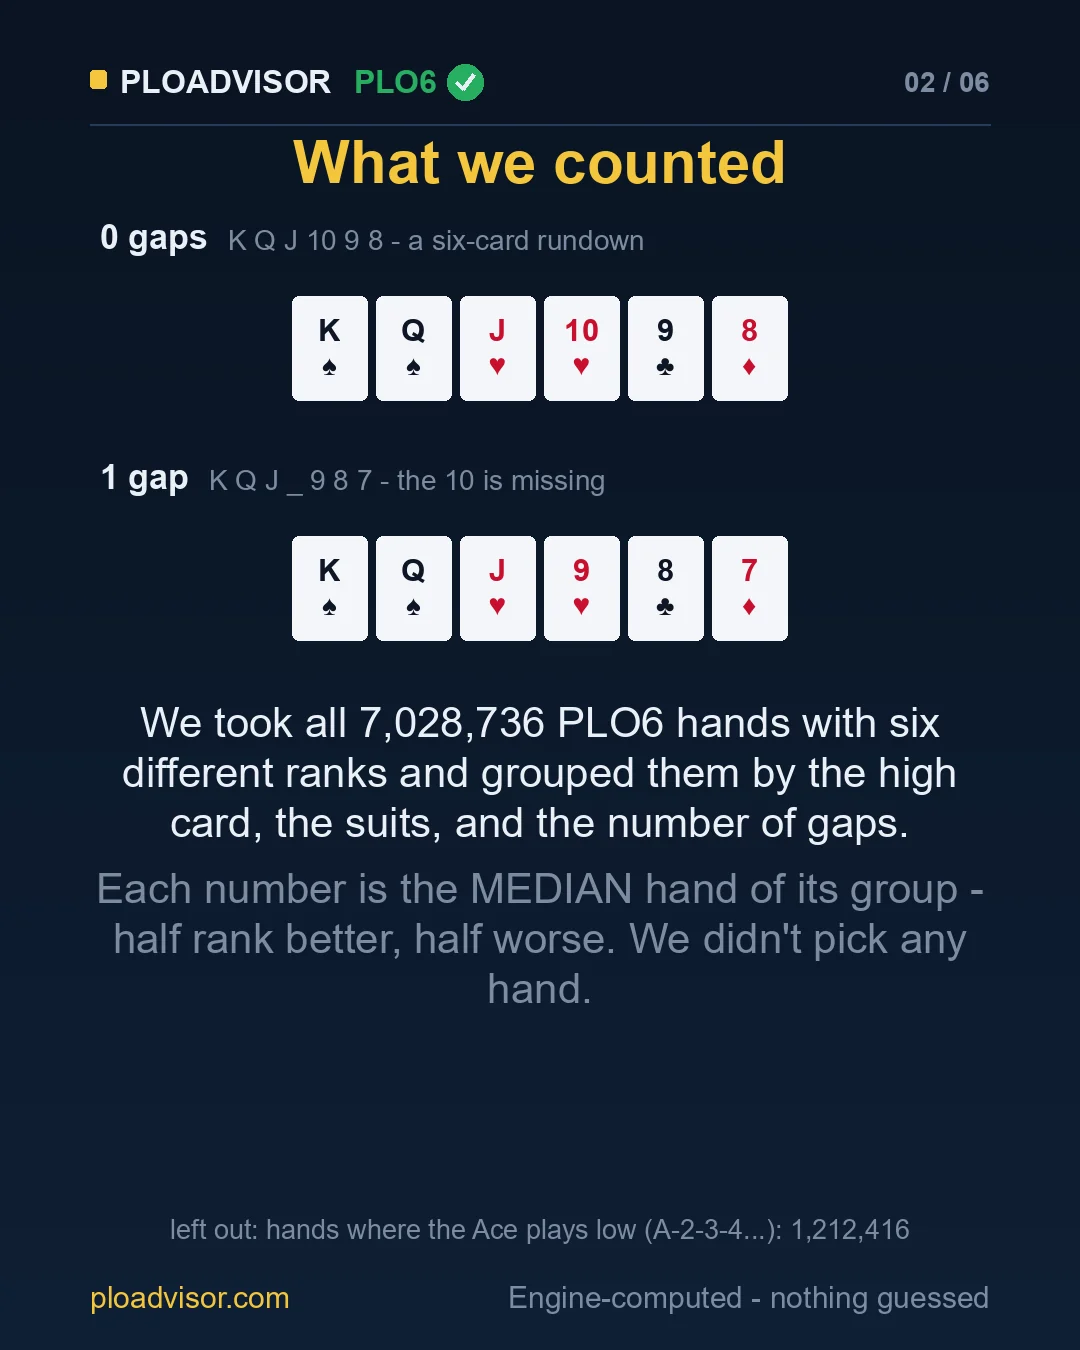
A gap is a rank missing inside your hand. K‑Q‑J‑10‑9‑8 is a six-card rundown: no gaps. K‑Q‑J‑9‑8‑7 has one: the 10 is missing. We counted the gaps as the ranks missing between the highest and the lowest card.
We took every PLO6 hand with six different ranks — 7,028,736 of them — and grouped them by three things: the high card (Ace, King or Queen), the suit structure, and the number of gaps. Every hand then gets its place in our PLO6 playability ranking, and each group is summarised by its median hand: half the group ranks better, half worse. Each hand class counts as many times as the concrete hands it stands for, so these are medians of real hands.
Why the high card had to be part of the grouping
Our first attempt grouped hands only by suits and gaps. The ladder came out wrong-looking: for triple-suited hands the median went from Top 12.3% with no gap to Top 20.1% at 3 gaps — and then turned back, ending at Top 17.2% with seven gaps.
The holes were not helping; the groups were not comparable. A hand can only have many gaps if its highest and lowest cards are far apart: 59% of the triple-suited hands with five or more gaps hold an Ace, and a hand with seven gaps has to (it runs from Ace to Two). The Ace was carrying them. Once the high card is fixed, every ladder in this article gets weaker at every step — and the price of a gap turns out to depend on that high card.
Same hole, three prices
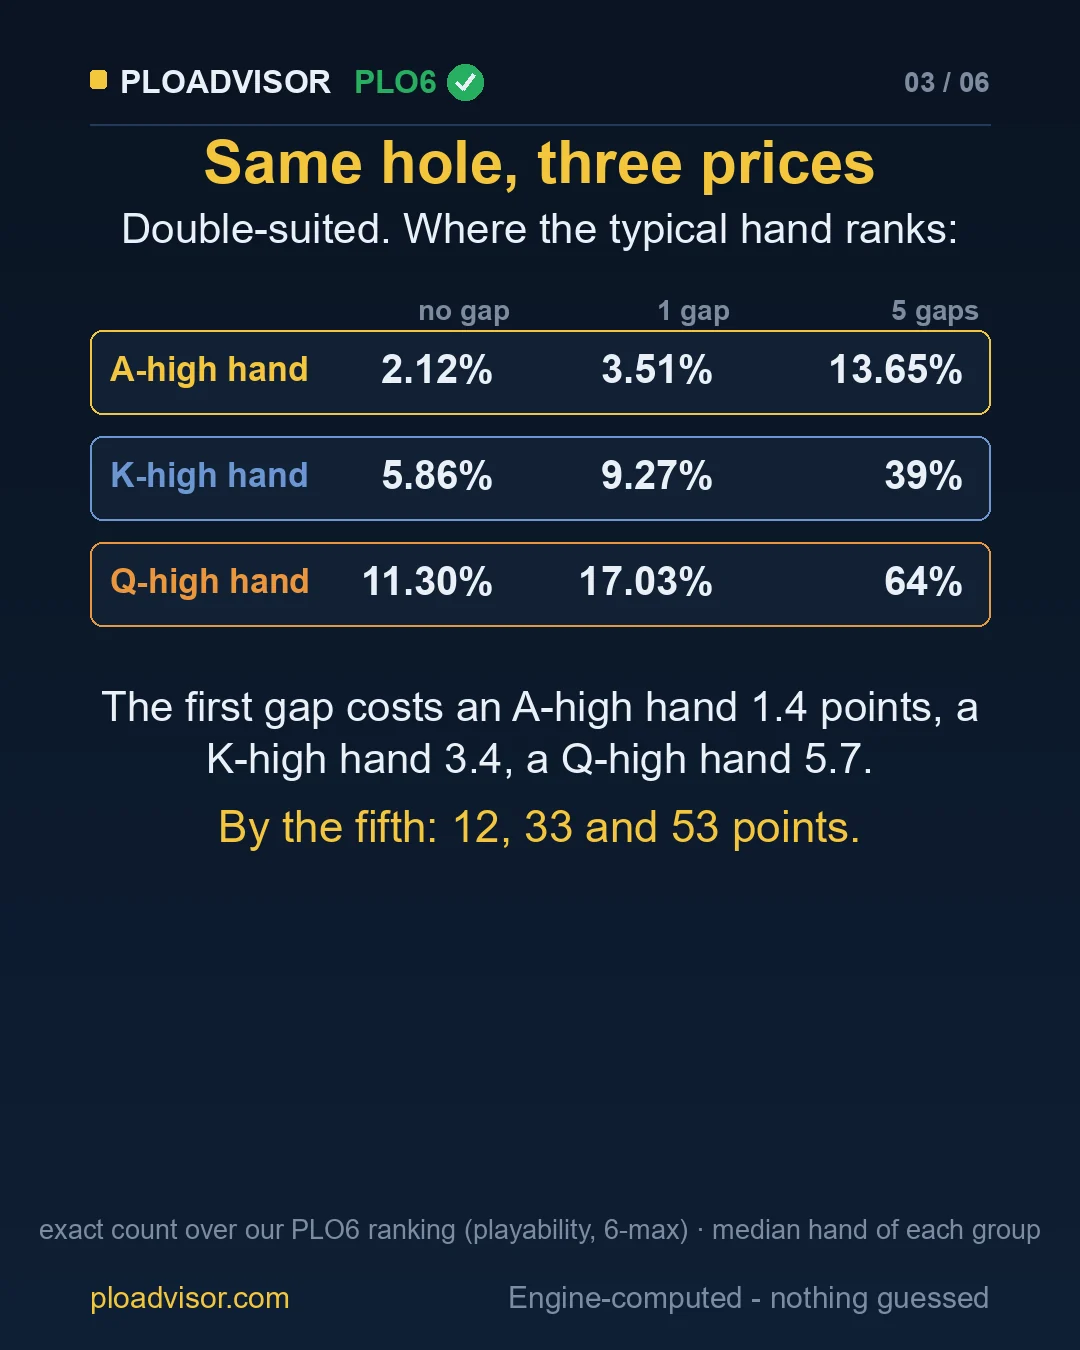
From no gap to five gaps, double-suited: A-high Top 2.12% → Top 13.65%, K-high Top 5.86% → Top 39%, Q-high Top 11.30% → Top 64%.
On the cover chart, the dashed line starts at the A-high hand with five gaps (Top 13.65%). It sits practically level with the K-high hand with two gaps (Top 13.25%), ahead of the K-high hand with three (Top 19.88%) and the Q-high hand with one (Top 17.03%) — and behind the perfect Q-high rundown (Top 11.30%).
The Ace buys you about four gaps
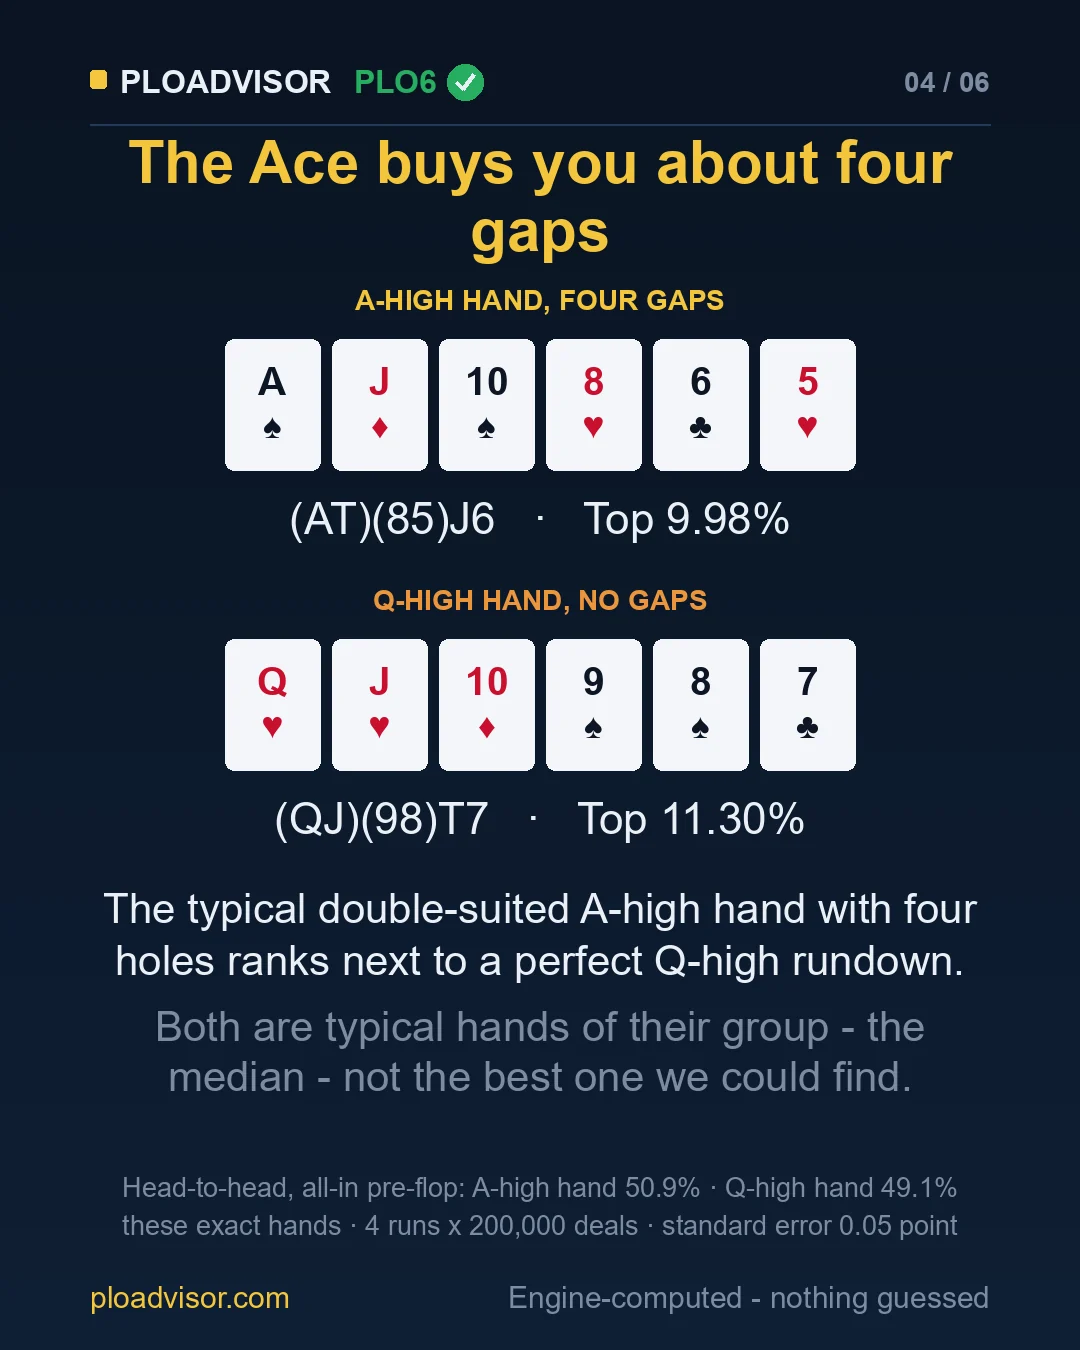
The typical double-suited A-high hand with four gaps, (AT)(85)J6, ranks Top 9.98%. The typical Q-high hand with no gaps at all, (QJ)(98)T7, ranks Top 11.30%.
Head-to-head, all-in before the flop, the exact hands on the slide split 50.9% for the A-high hand and 49.1% for the Q-high hand (4 runs of 200,000 deals, standard error 0.05 point).
That number belongs to those exact cards. The same two hand classes, with the suits crossed differently, give the A-high hand anywhere from 48.2% to 53.8% — the favourite can change with the suits alone. Averaged over all 11 ways to suit the Q-high hand without sharing a card with the A-high hand, the A-high hand wins 51.8%. That is why the slide prints the equity of the exact cards it shows.
More suits, cheaper gaps
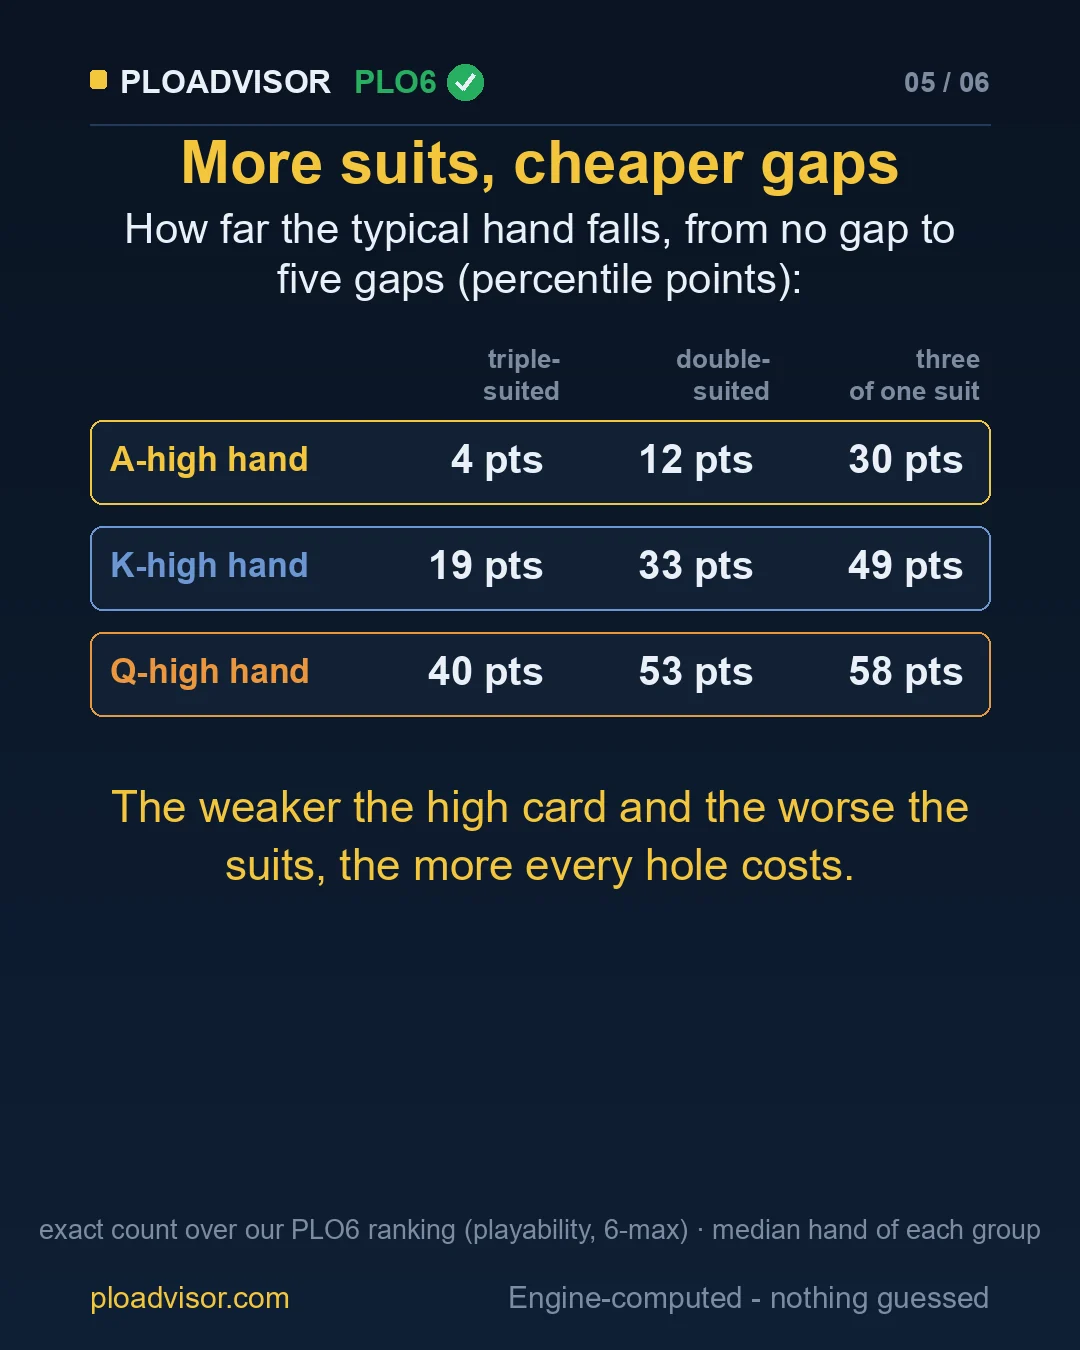
Percentile points lost from no gap to five gaps (typical hand):
| High card | Triple-suited | Double-suited | Three cards of one suit |
|---|---|---|---|
| A-high hand | 4 | 12 | 30 |
| K-high hand | 19 | 33 | 49 |
| Q-high hand | 40 | 53 | 58 |
The weaker the high card and the worse the suits, the more every hole costs.
The whole grid
Median hand of each group, with the middle half of the group (25th to 75th percentile hand) below it.
Triple-suited
| High card | 0 gaps | 1 gap | 2 gaps | 3 gaps | 4 gaps | 5 gaps |
|---|---|---|---|---|---|---|
| A-high hand | Top 0.40% 0.3–0.5% | Top 0.86% 0.7–1.1% | Top 1.52% 1.1–2.2% | Top 2.71% 1.9–3.6% | Top 3.47% 2.3–5.0% | Top 4.89% 3.4–7.2% |
| K-high hand | Top 2.33% 2.0–2.6% | Top 3.95% 3.3–4.4% | Top 5.71% 4.7–7.2% | Top 8.50% 7.0–11.3% | Top 13.55% 9.2–17.2% | Top 21.16% 14.2–28.6% |
| Q-high hand | Top 5.38% 5.1–5.5% | Top 8.13% 7.2–10.3% | Top 13.90% 10.3–15.9% | Top 20.10% 13.4–22.2% | Top 30% 22.3–37.0% | Top 45% 33.4–58.7% |
Double-suited
| High card | 0 gaps | 1 gap | 2 gaps | 3 gaps | 4 gaps | 5 gaps |
|---|---|---|---|---|---|---|
| A-high hand | Top 2.12% 1.2–3.1% | Top 3.51% 2.6–5.2% | Top 5.23% 3.7–7.9% | Top 7.52% 5.5–11.9% | Top 9.98% 6.5–15.2% | Top 13.65% 9.0–22.1% |
| K-high hand | Top 5.86% 4.5–7.1% | Top 9.27% 7.5–12.3% | Top 13.25% 10.9–17.3% | Top 19.88% 14.9–24.4% | Top 27.07% 20.1–34.8% | Top 39% 29.1–50.1% |
| Q-high hand | Top 11.30% 9.6–12.4% | Top 17.03% 14.5–20.2% | Top 24.86% 20.9–29.7% | Top 34% 26.7–41.4% | Top 48% 38.0–57.2% | Top 64% 51.4–76.0% |
Three cards of one suit
| High card | 0 gaps | 1 gap | 2 gaps | 3 gaps | 4 gaps | 5 gaps |
|---|---|---|---|---|---|---|
| A-high hand | Top 8.01% 7.7–10.6% | Top 14.28% 11.1–16.5% | Top 18.71% 15.2–23.3% | Top 25.19% 21.0–31.3% | Top 29.03% 24.3–37.1% | Top 38% 30.1–47.0% |
| K-high hand | Top 15.80% 15.4–18.7% | Top 24.62% 20.4–27.9% | Top 32% 27.4–37.1% | Top 41% 36.2–46.4% | Top 51% 43.3–59.4% | Top 64% 54.9–73.9% |
| Q-high hand | Top 23.94% 23.3–26.1% | Top 34% 31.3–39.3% | Top 45% 39.3–49.7% | Top 56% 46.0–61.3% | Top 69% 59.8–76.0% | Top 82% 72.9–89.3% |
What this does not say yet
- Why. A natural explanation is that an A-high hand leans on its nut flushes while a hand without an Ace leans on its straights, so holes hurt it more. We have not measured that here; it is a hypothesis.
- Suited or bare Ace. The A-high groups mix hands where the Ace has a suit partner and hands where it does not. In our broadway ladder, two Aces with no broadway ranked Top 2.82% when suited and Top 32% when bare; here that difference is averaged inside each group.
- Only the high card is fixed. The second card also matters (A-K-9-8-7 is not A-9-8-7-6), and it is not controlled here.
- Wheel hands are left out. When the Ace plays better as a low card (A-2-3-4...), counting it as the high card would make the hand look full of gaps. Those 1,212,416 hands are excluded.
- We stopped at the Queen. Ten-high hands are in the data, but players rarely give them much value; the comparison that matters in practice is Ace, King and Queen.
How these numbers were produced
- Exact: the grouping and the medians are counted over every hand, weighted by the number of concrete hands per class. The counts add up to all C(52,6) PLO6 hands, and the hands with six different ranks match an independent count, C(13,6)×46 = 7,028,736.
- Simulated: the order of the ranking itself (our PLO6 playability ranking, 6-max — how we built it). Deeper in the ranking the estimates are less precise, which is why those medians are shown without decimals (Top 64%).
- Equity: Monte Carlo, 4 independent runs of 200,000 deals for the exact hands; standard error 0.05 point.