Every hand ranking prints a number like “Top 23%”. That number is a measurement, made by dealing the hand out hundreds of thousands of times — and every measurement has an error bar. We ranked the PLO6 (six-card Pot-Limit Omaha) top 30% three separate times to measure ours.
Key numbers
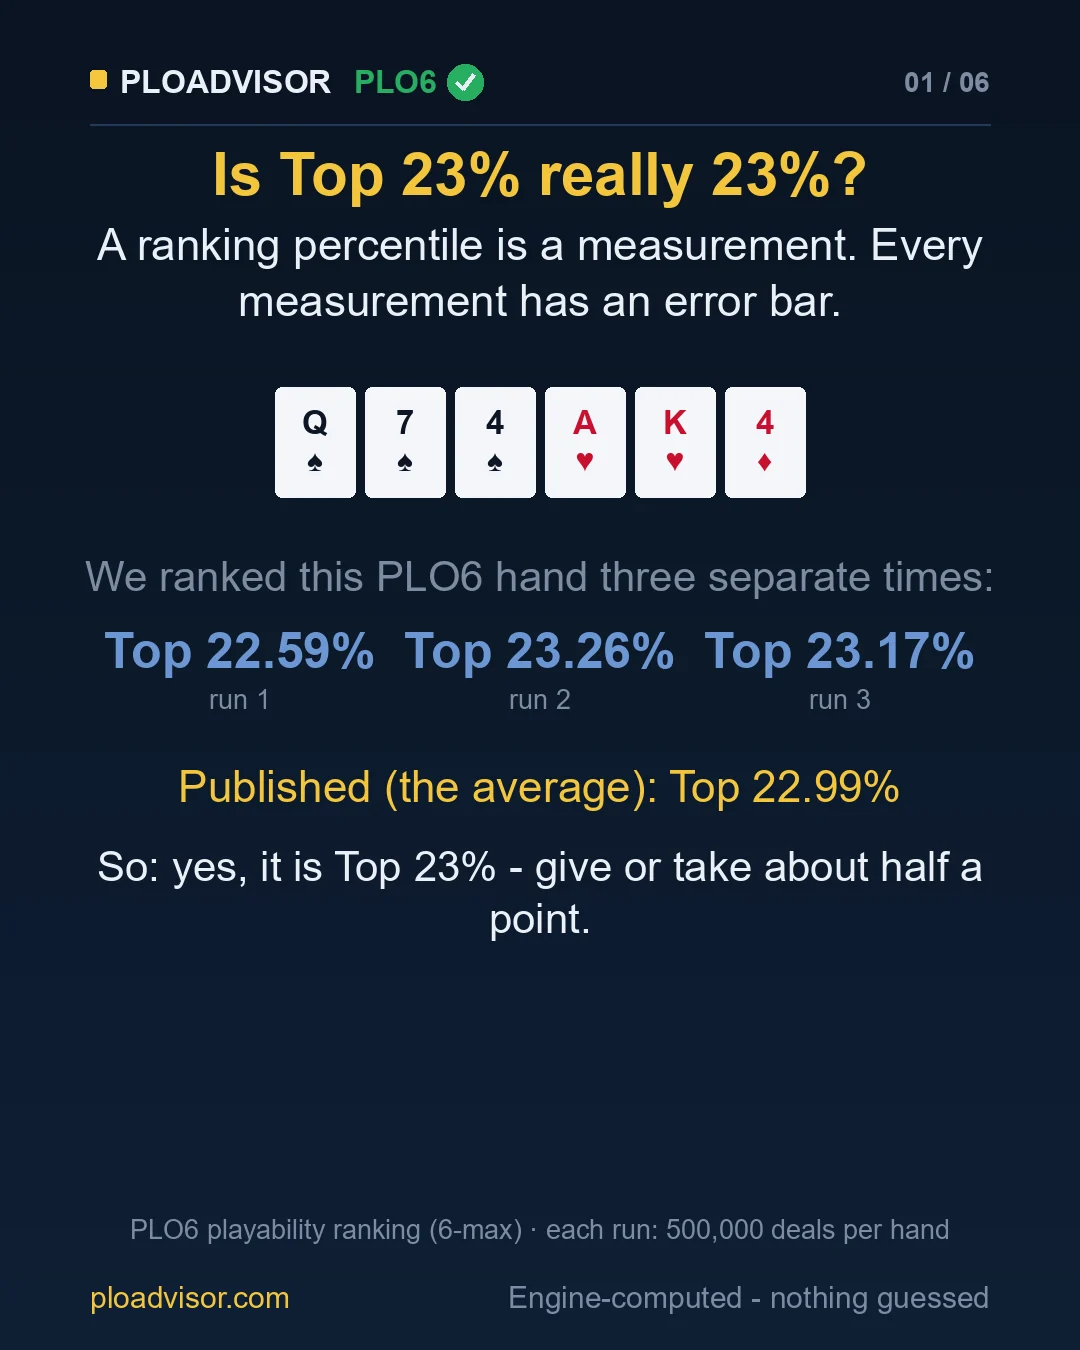
- The same hand, ranked three times: Top 22.59%, 23.26% and 23.17%. Published (the average): Top 22.99%.
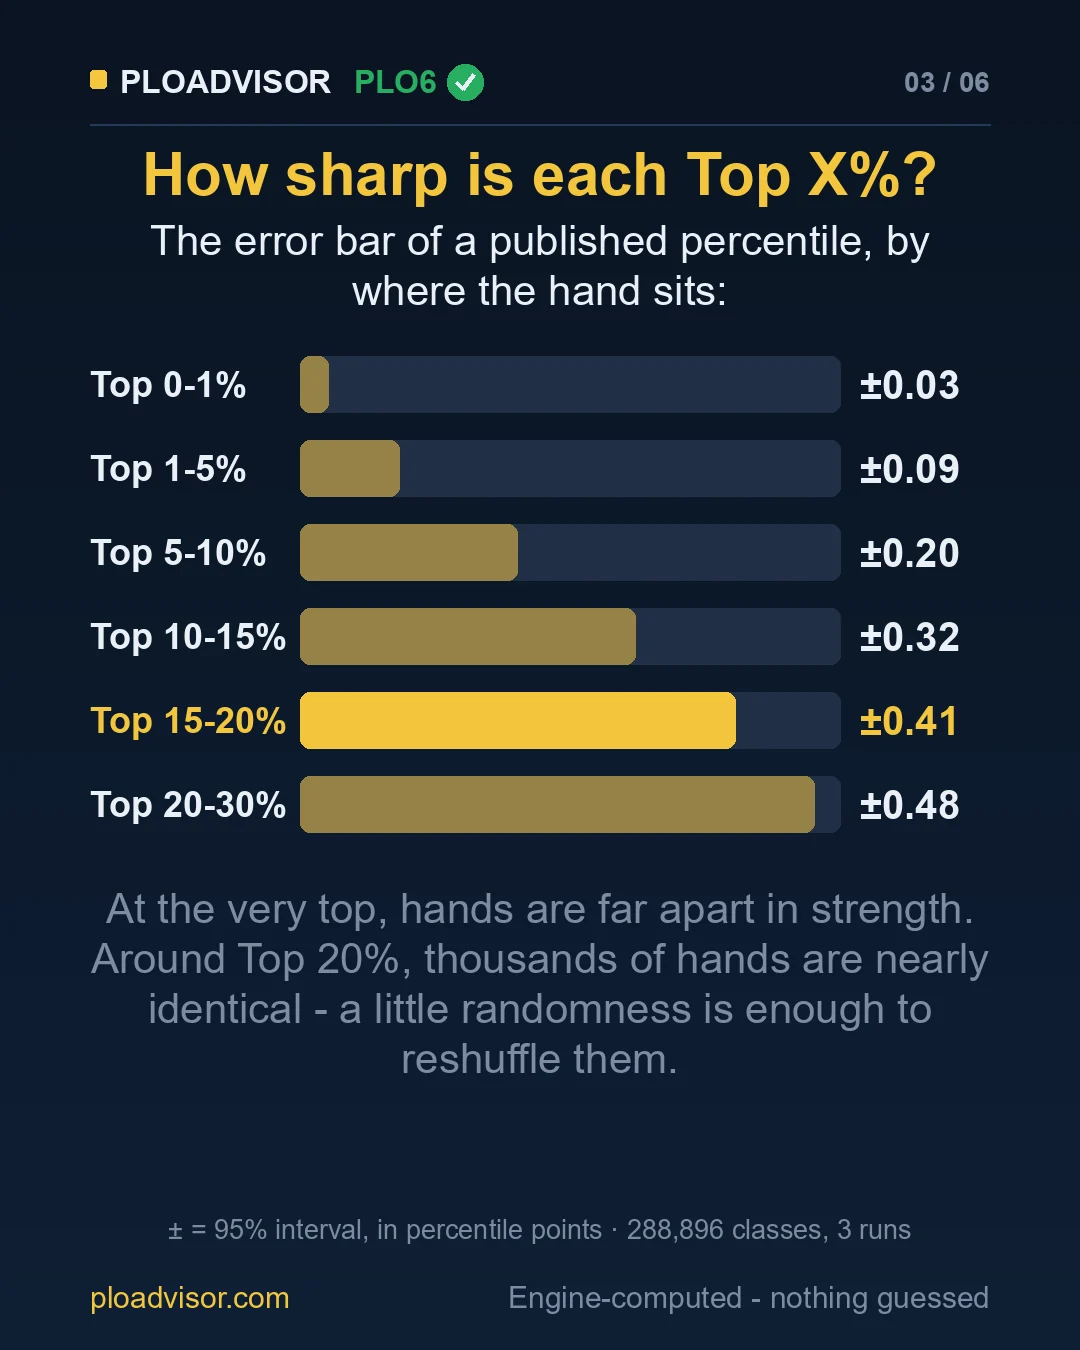
- The error bar grows with depth: ±0.03 points in the Top 0–1%, ±0.48 in the Top 20–30%.
- In the Top 15–20%, two hands half a point apart are in the wrong order 5% of the time; one point apart, practically never.
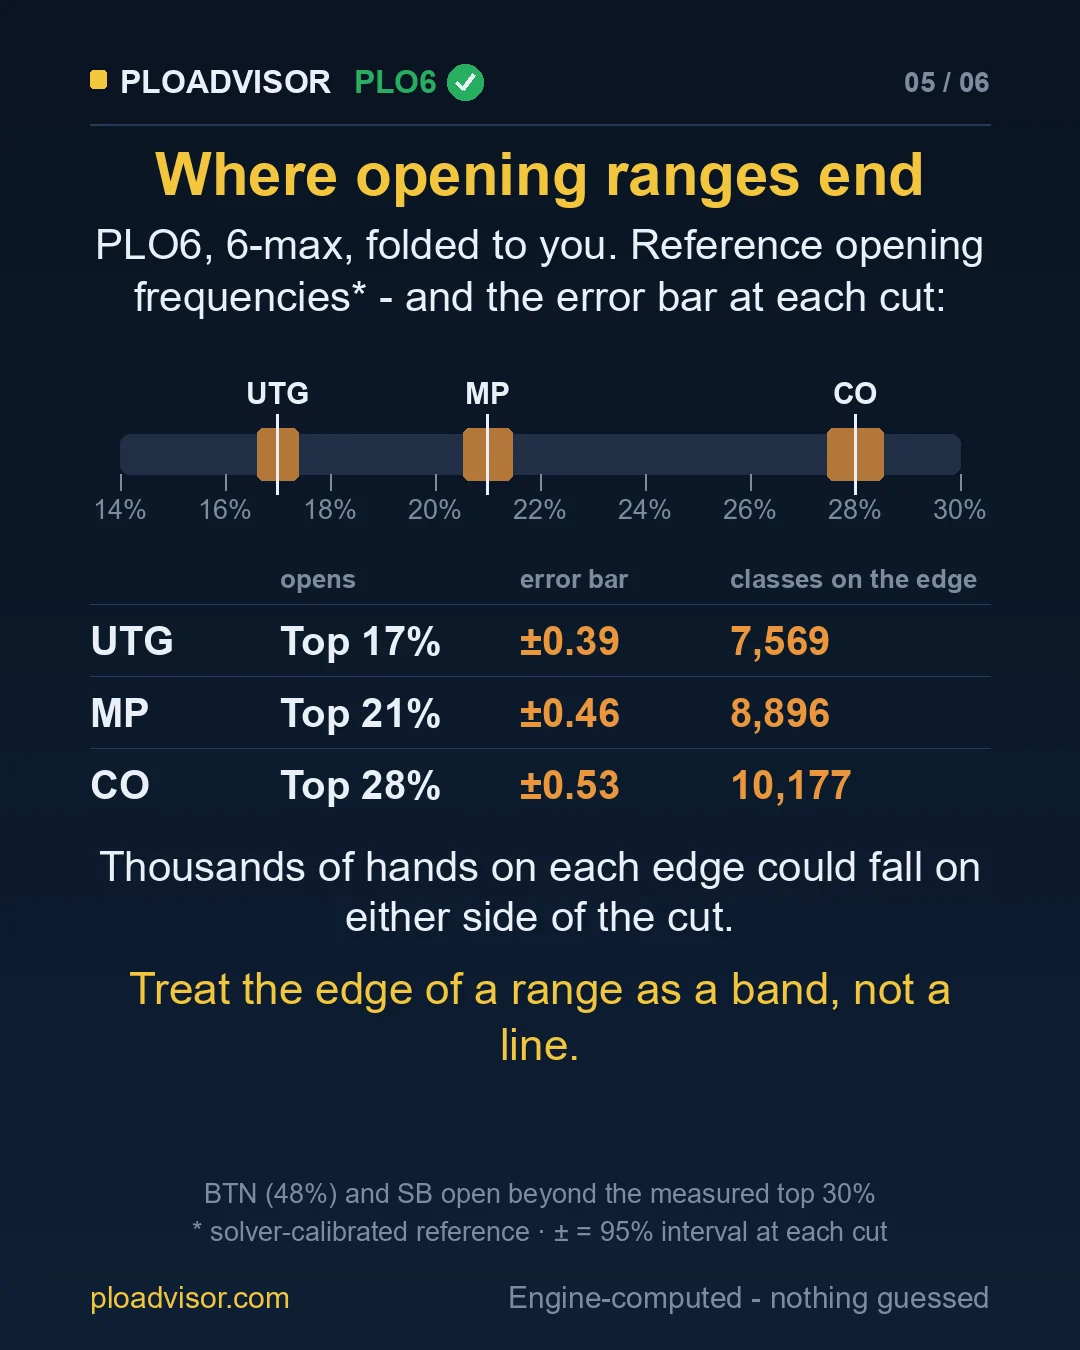
- Reference 6-max opening frequencies end at UTG 17%, MP 21% and CO 28% — and 7,569 hand classes sit inside the error bar of the UTG cut alone.
One hand, three runs
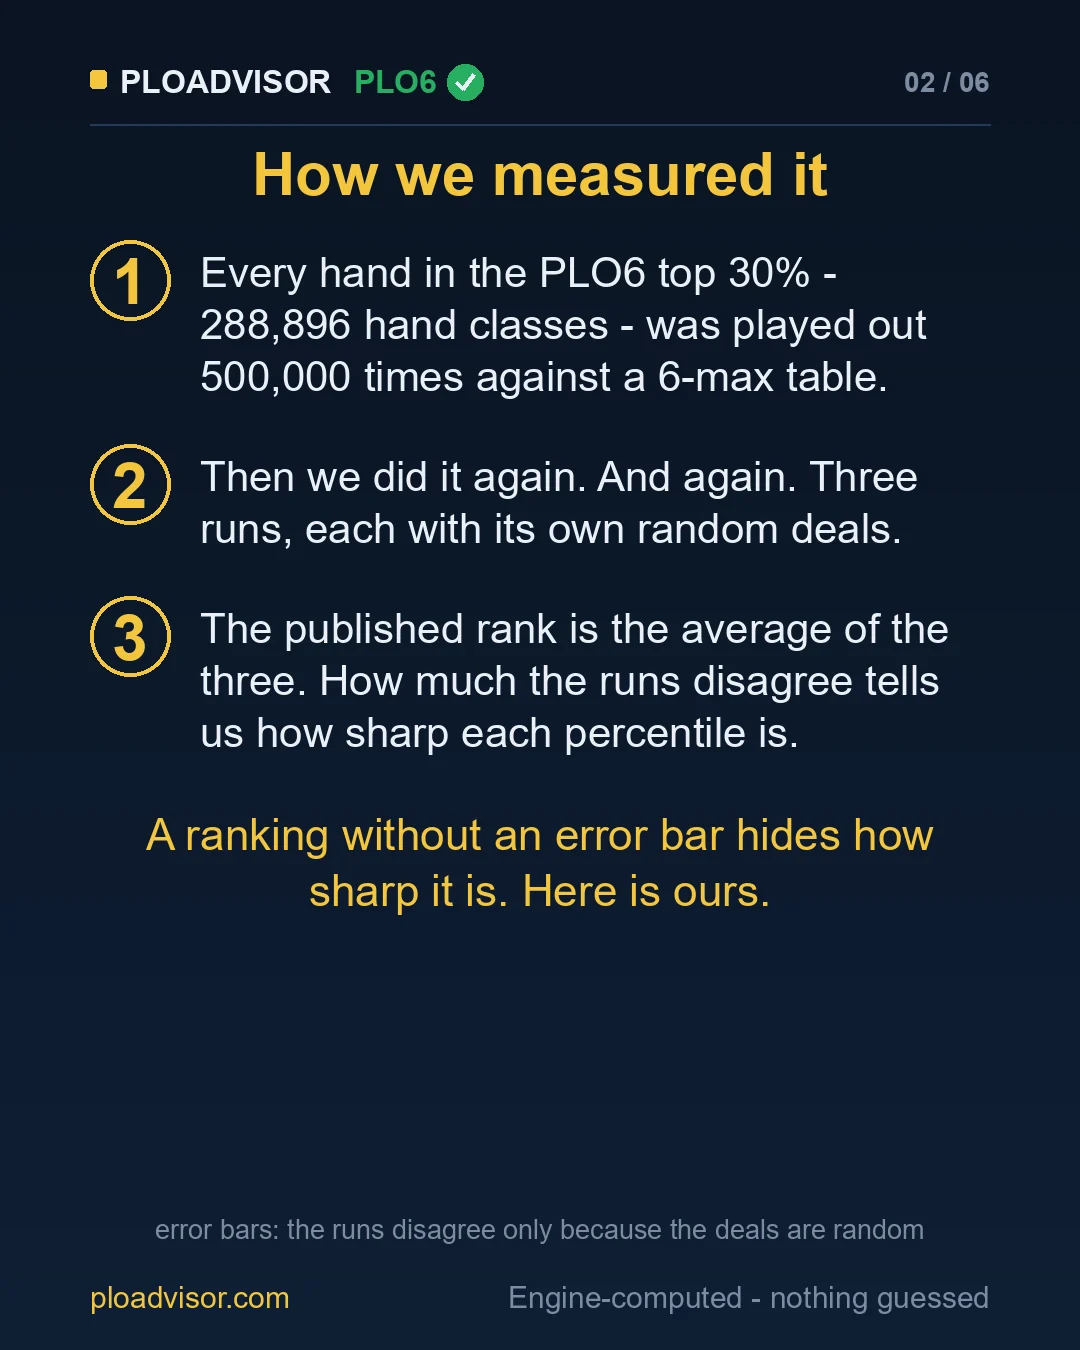
The hand above is Q♠ 7♠ 4♠ A♥ K♥ 4♦. Our playability ranking deals every hand in the top 30% against a 6-max table, 500,000 times, and orders the hands by result. We did that three times, each run with its own random deals. This hand came out at Top 22.59%, 23.26% and 23.17%. The published percentile is the average, Top 22.99% — so yes, it is a Top 23% hand, give or take about half a point.
How sharp is each Top X%?
How much the three runs disagree, hand by hand, measures how sharp each percentile is. The error bar below is a 95% interval for the published (averaged) percentile; the middle column shows how far a single run typically moves a hand, for comparison:
| Where the hand sits | Hand classes | One run: typical swing | Published (average of 3): error bar |
|---|---|---|---|
| Top 0–1% | 9,629 | 0.03 pts | ±0.03 pts |
| Top 1–5% | 38,520 | 0.12 pts | ±0.09 pts |
| Top 5–10% | 48,149 | 0.27 pts | ±0.20 pts |
| Top 10–15% | 48,150 | 0.44 pts | ±0.32 pts |
| Top 15–20% | 48,149 | 0.57 pts | ±0.41 pts |
| Top 20–30% | 96,299 | 0.66 pts | ±0.48 pts |
At the very top, hands are far apart in strength, and a little randomness cannot reorder them. Around Top 20%, thousands of hands are nearly identical — the same small randomness is enough to reshuffle them.
Two hands, close in the ranking: is the order right?
Take two hands a given distance apart in the published ranking. How often is their published order backwards? 50% is a coin flip:
| Points apart | Top 0–1% | Top 1–5% | Top 5–10% | Top 10–15% | Top 15–20% | Top 20–30% |
|---|---|---|---|---|---|---|
| 0.01 | 24% | 43% | 47% | 48% | 49% | 49% |
| 0.05 | 1% | 21% | 36% | 41% | 43% | 44% |
| 0.1 | ~0 | 7% | 24% | 33% | 37% | 38% |
| 0.25 | ~0 | ~0 | 5% | 13% | 20% | 23% |
| 0.5 | – | ~0 | ~0 | 1% | 5% | 8% |
| 1 | – | ~0 | ~0 | ~0 | ~0 | ~0 |
“–”: the Top 0–1% band is only one point wide, too narrow for hands half a
point or more apart. 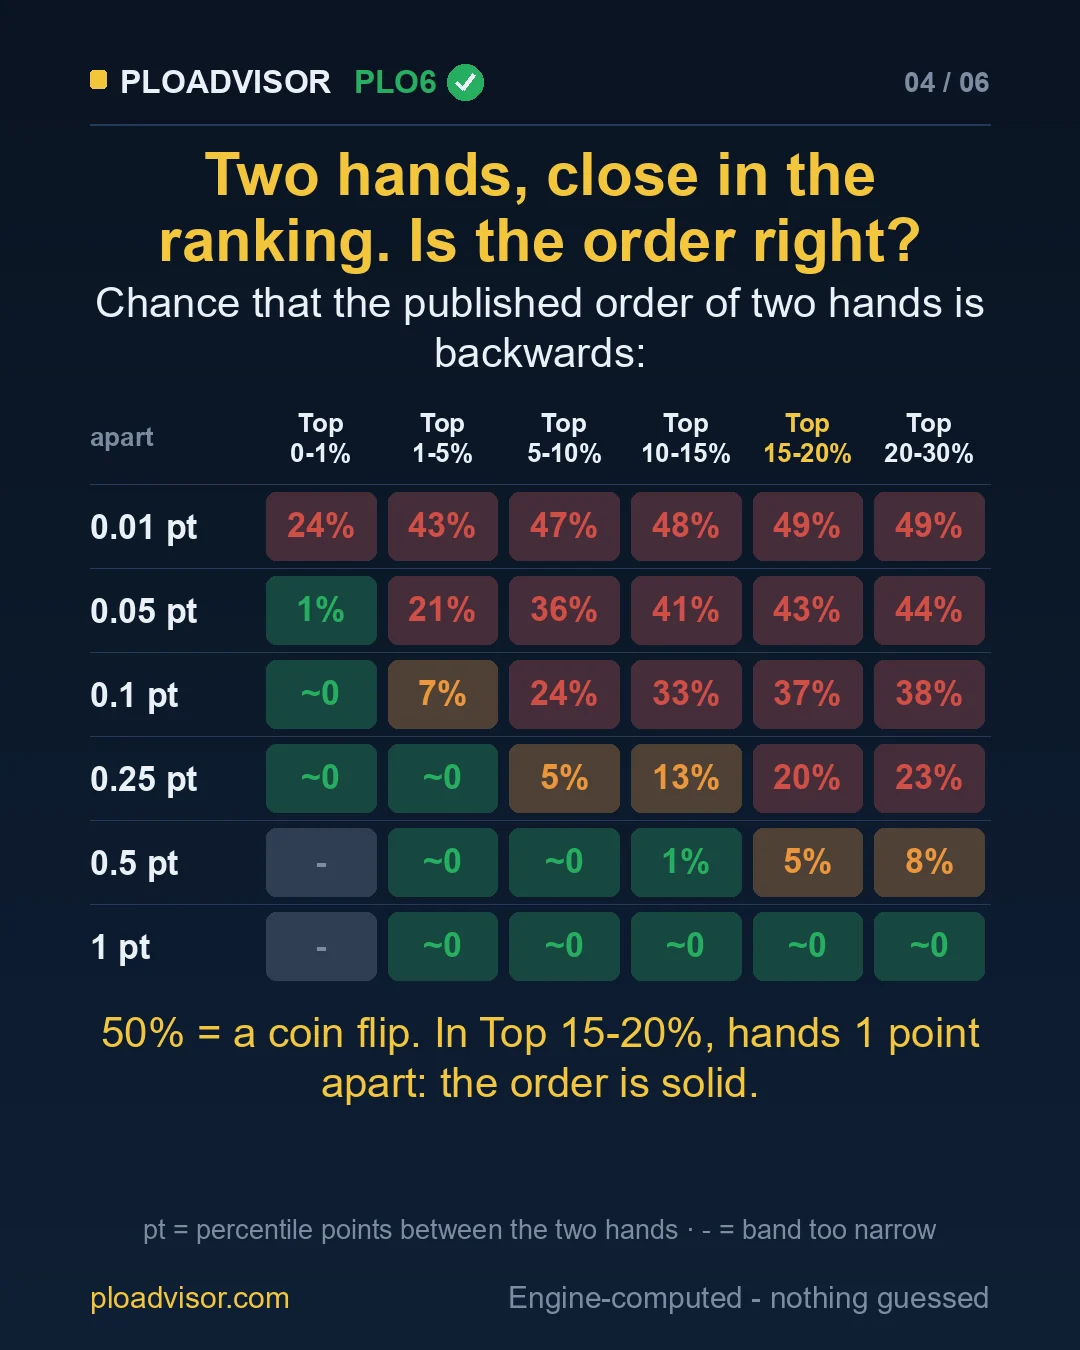
Where opening ranges end
For PLO6 6-max, folded to you, the solver-calibrated reference frequencies we use open about the top 17% of hands under the gun, 21% from the middle position and 28% from the cutoff. We measured the error bar right at each cut, from the hands within half a point of it:
| Position | Opens (reference) | Error bar at the cut | Hand classes inside it |
|---|---|---|---|
| UTG | Top 17% | ±0.39 pts | 7,569 |
| MP | Top 21% | ±0.46 pts | 8,896 |
| CO | Top 28% | ±0.53 pts | 10,177 |
Thousands of hand classes sit inside each of those error bars: the ranking cannot tell which side of the cut they belong to. The button (48%) and the small blind open deeper, below the top 30% we measured here. Treat the edge of a range as a band, not a line.
What this does not measure
- Below the top 30%. That part of the ranking comes from a single run of 100,000 deals per hand, so there is nothing to compare it with; its error bars are not measured here and are wider.
- Only the randomness of the deals. The error bar says how much the order would move if we dealt the hands again. It does not test the model itself — who calls, against which hands. That is a choice of method, described in how we built the ranking.
- Hand classes, not concrete hands. Percentiles count each hand class once, however many concrete hands it stands for.
How these numbers were produced
- Simulated: 288,896 hand classes (the PLO6 top 30% of 962,988), 500,000 deals each, in three runs with different random seeds. The published ranking is their average.
- Error bars: for each hand, the spread of its percentile across the three runs; pooled over the band, divided by √3 for the average, 95% = 1.96 standard deviations.
- Checked: if the three runs are independent, the noise they show predicts how often two runs disagree on the order of two hands. Over 6,000 pairs per cell, the prediction matched what the runs actually did within 1.3 points in every cell of the table.