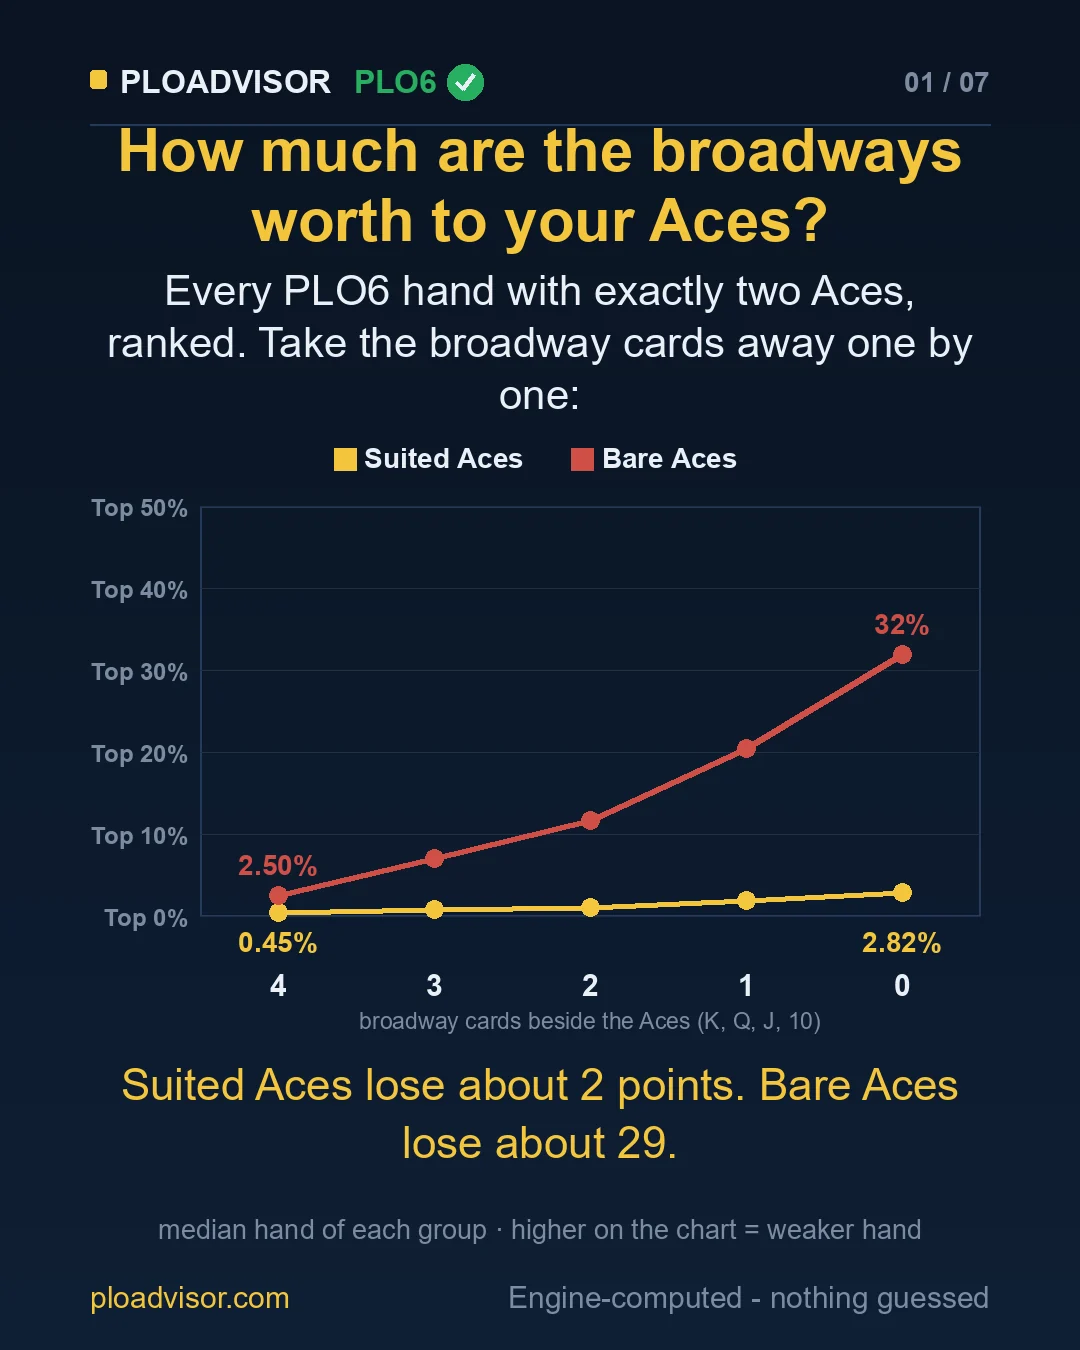
Take the broadway cards (K, Q, J, 10) away from a PLO6 (six-card Pot-Limit Omaha) hand with two Aces, one by one. If the Aces are suited, the typical hand slides from Top 0.45% to Top 2.82% — about 2 percentile points. If the Aces are bare, it falls from Top 2.50% to Top 32% — about 29 points. The broadways matter most exactly when the Aces have no suits.
Key numbers
- Measured over all 1,167,480 PLO6 hands with exactly two Aces — no hand picked by us. Each number is the median hand of its group.
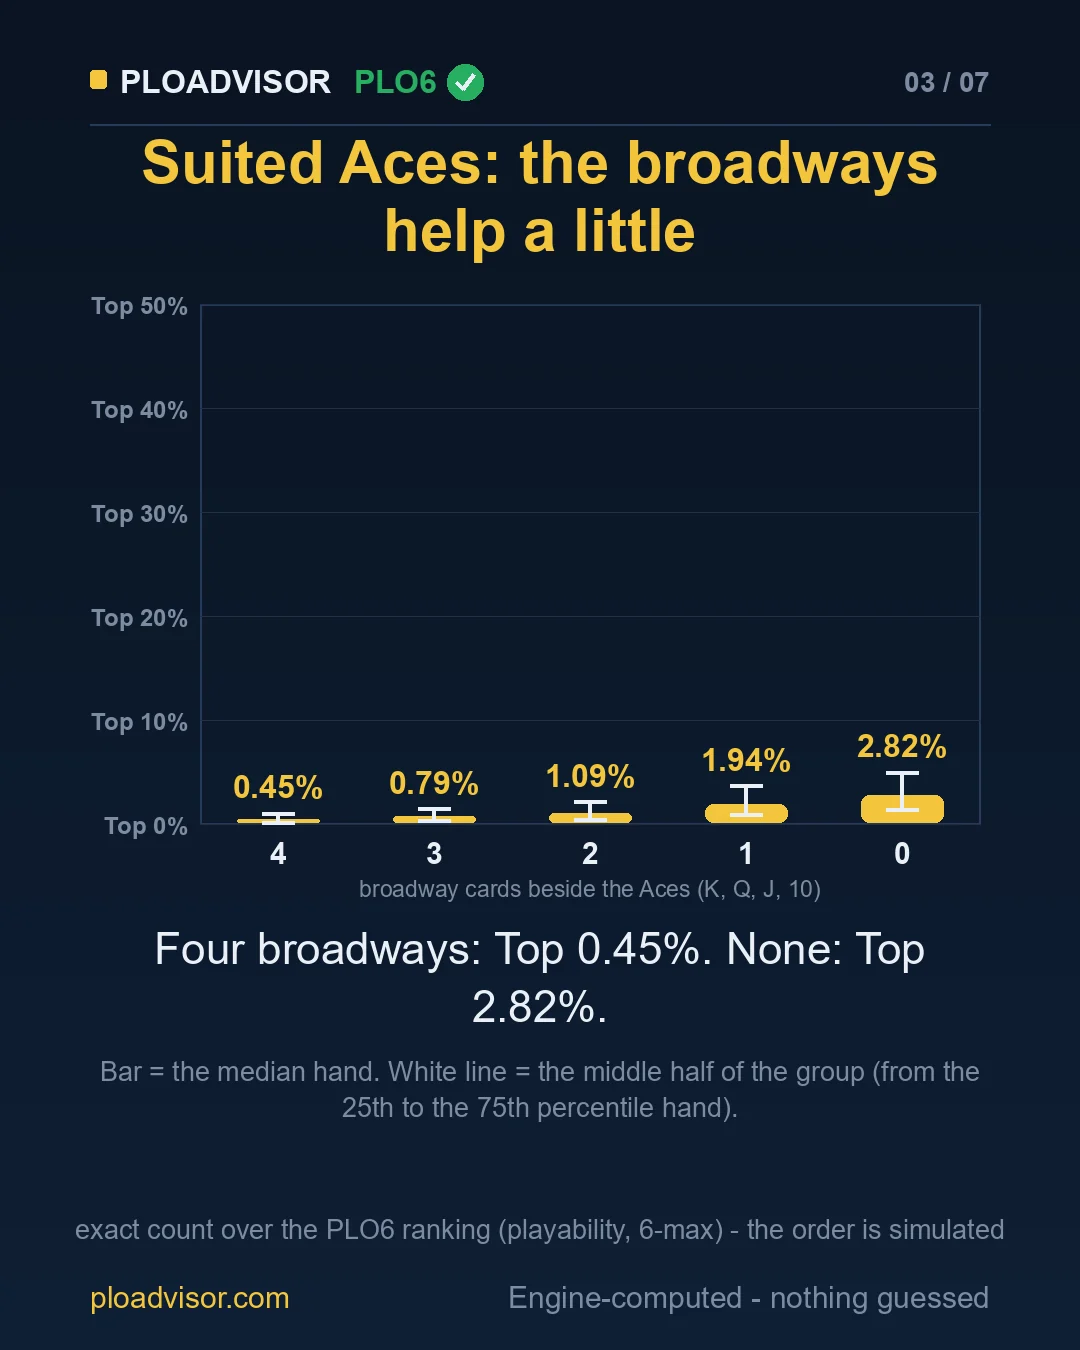
- Suited Aces: 4 broadways Top 0.45% → none Top 2.82%.
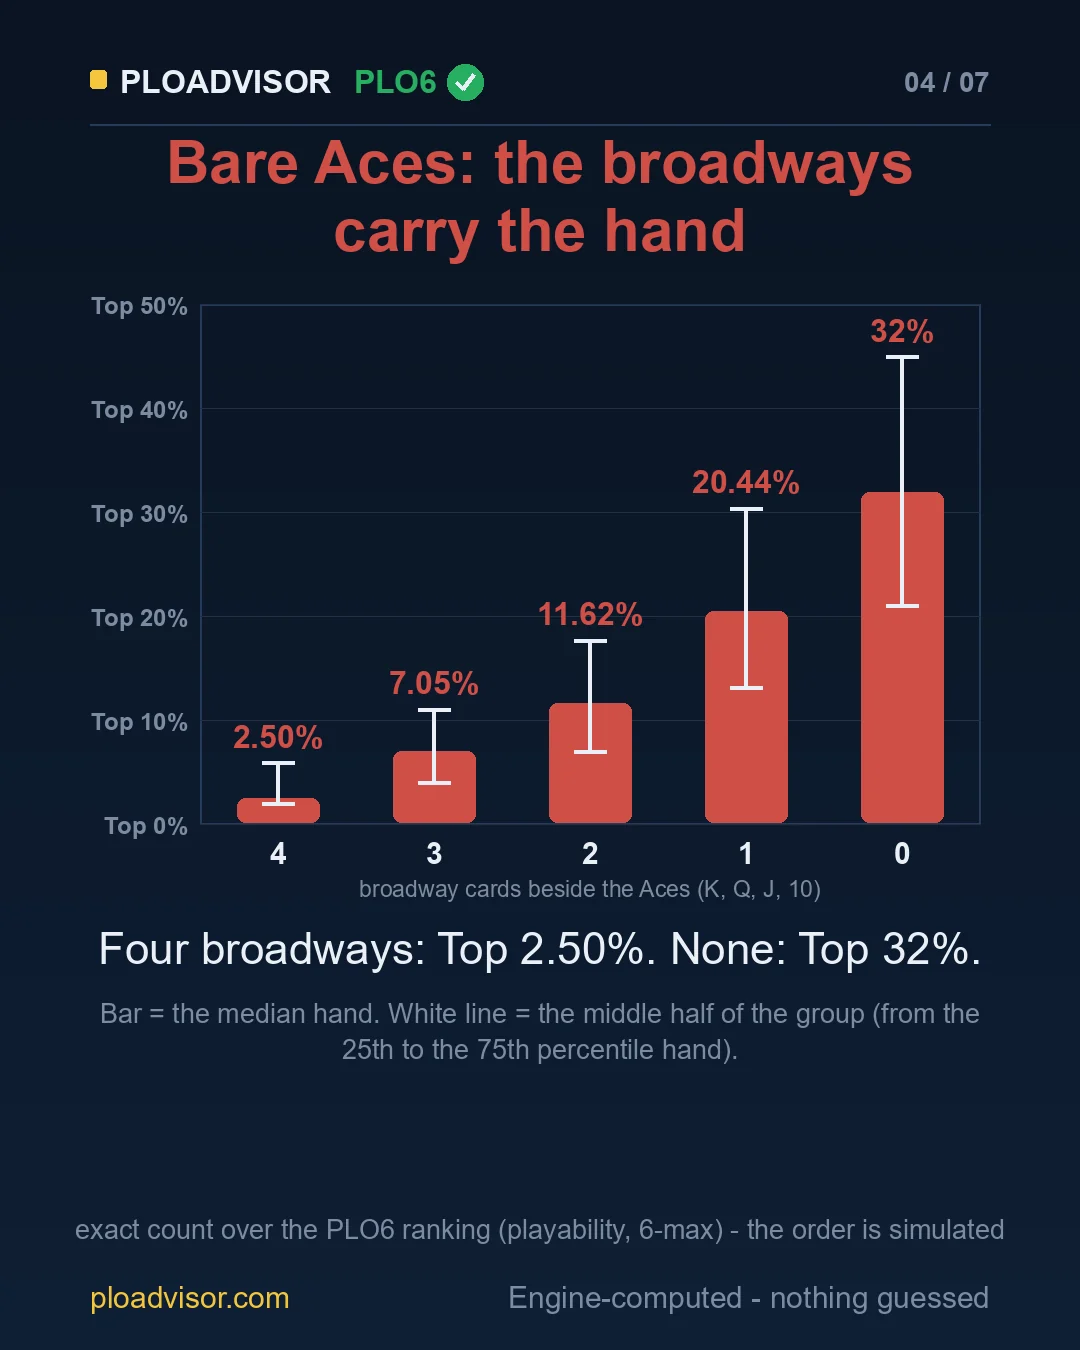
- Bare Aces: 4 broadways Top 2.50% → none Top 32%.
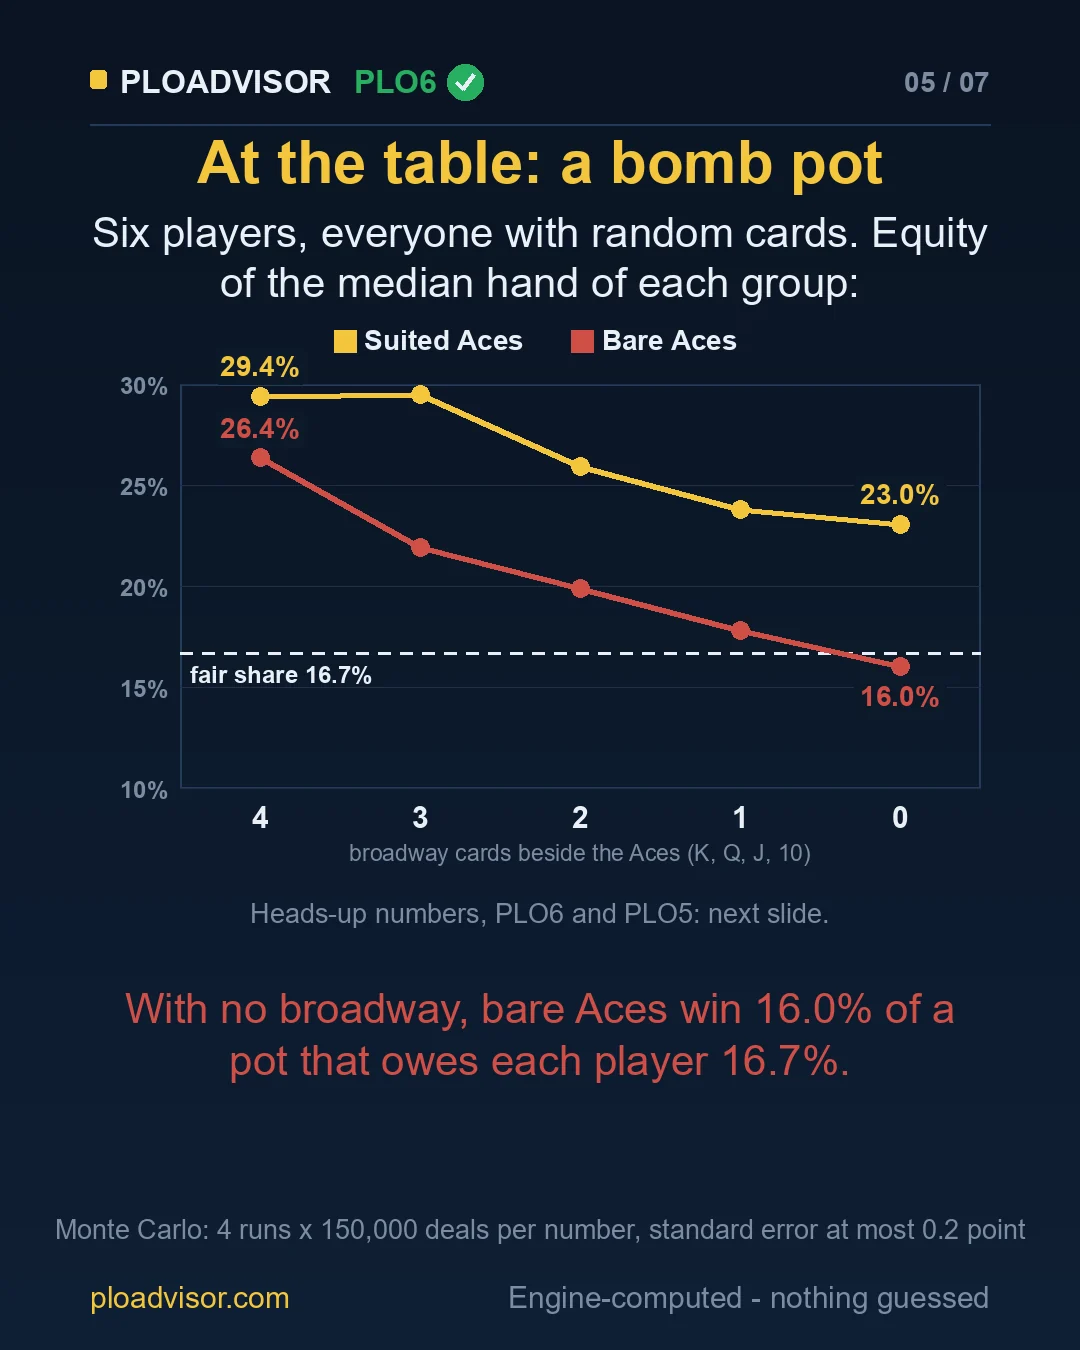
- In a six-player bomb pot, bare Aces with no broadway win 16.0% of the pot — less than the 16.7% each player is owed.
How we measured: every hand, not a few examples
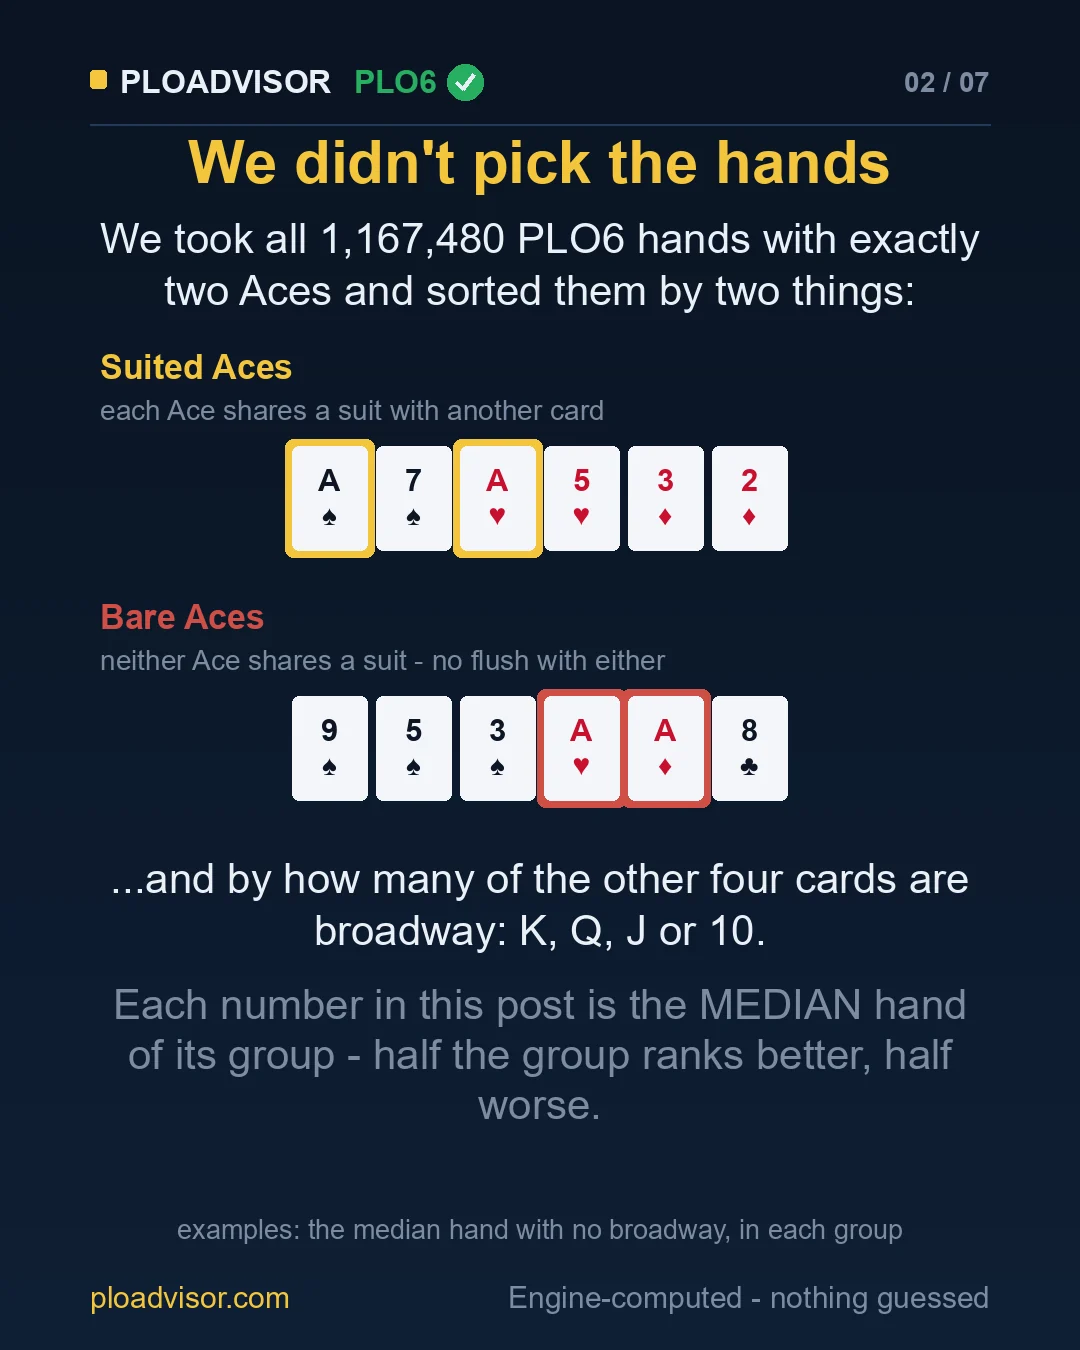
A single example hand can say almost anything, so we did not pick any. We took every PLO6 hand with exactly two Aces — 1,167,480 of them — and sorted them by two things:
- Do the Aces have suit partners? Suited Aces: each Ace shares a suit with another card. Bare Aces: neither does, so neither Ace can make a flush (in Omaha you play exactly two cards from your hand). In between, one Ace suited.
- How many of the other four cards are broadway cards: 4, 3, 2, 1 or 0.
Every hand then gets its place in our PLO6 playability ranking, and each group is summarised by its median hand: half the group ranks better, half worse. Each hand class counts as many times as the concrete hands it stands for, so these are medians of real hands, not of classes.
The whole grid
Median hand of each group, with the middle half of the group (25th to 75th percentile hand) below it:
| Broadways beside the Aces | Suited Aces | One Ace suited | Bare Aces |
|---|---|---|---|
| 4 broadways | Top 0.45% 0.2–1.0% | Top 1.4% 0.8–4.2% | Top 2.50% 2.0–5.9% |
| 3 broadways | Top 0.79% 0.3–1.5% | Top 2.6% 1.6–6.1% | Top 7.05% 4.0–11.1% |
| 2 broadways | Top 1.09% 0.4–2.1% | Top 4.4% 2.5–8.3% | Top 11.62% 7.0–17.7% |
| 1 broadway | Top 1.94% 0.9–3.7% | Top 7.8% 4.4–14.4% | Top 20.44% 13.1–30.4% |
| 0 broadways | Top 2.82% 1.4–5.0% | Top 12.4% 7.0–20.9% | Top 32% 21.0–44.9% |
Every column gets weaker at every step. The difference is the size of the step: along the suited column the whole ladder spans about 2 points; along the bare column, about 29.
At the table: equity
A ranking is one lens. The other is what the hand actually wins. For the median hand of each group we measured its equity in three situations: heads-up against a random hand, in a six-player bomb pot (everyone with random cards), and heads-up against a player who only plays the top 30% of hands.
| Group | Median hand | Heads-up vs random | Bomb pot, 6 players | Heads-up vs top 30% |
|---|---|---|---|---|
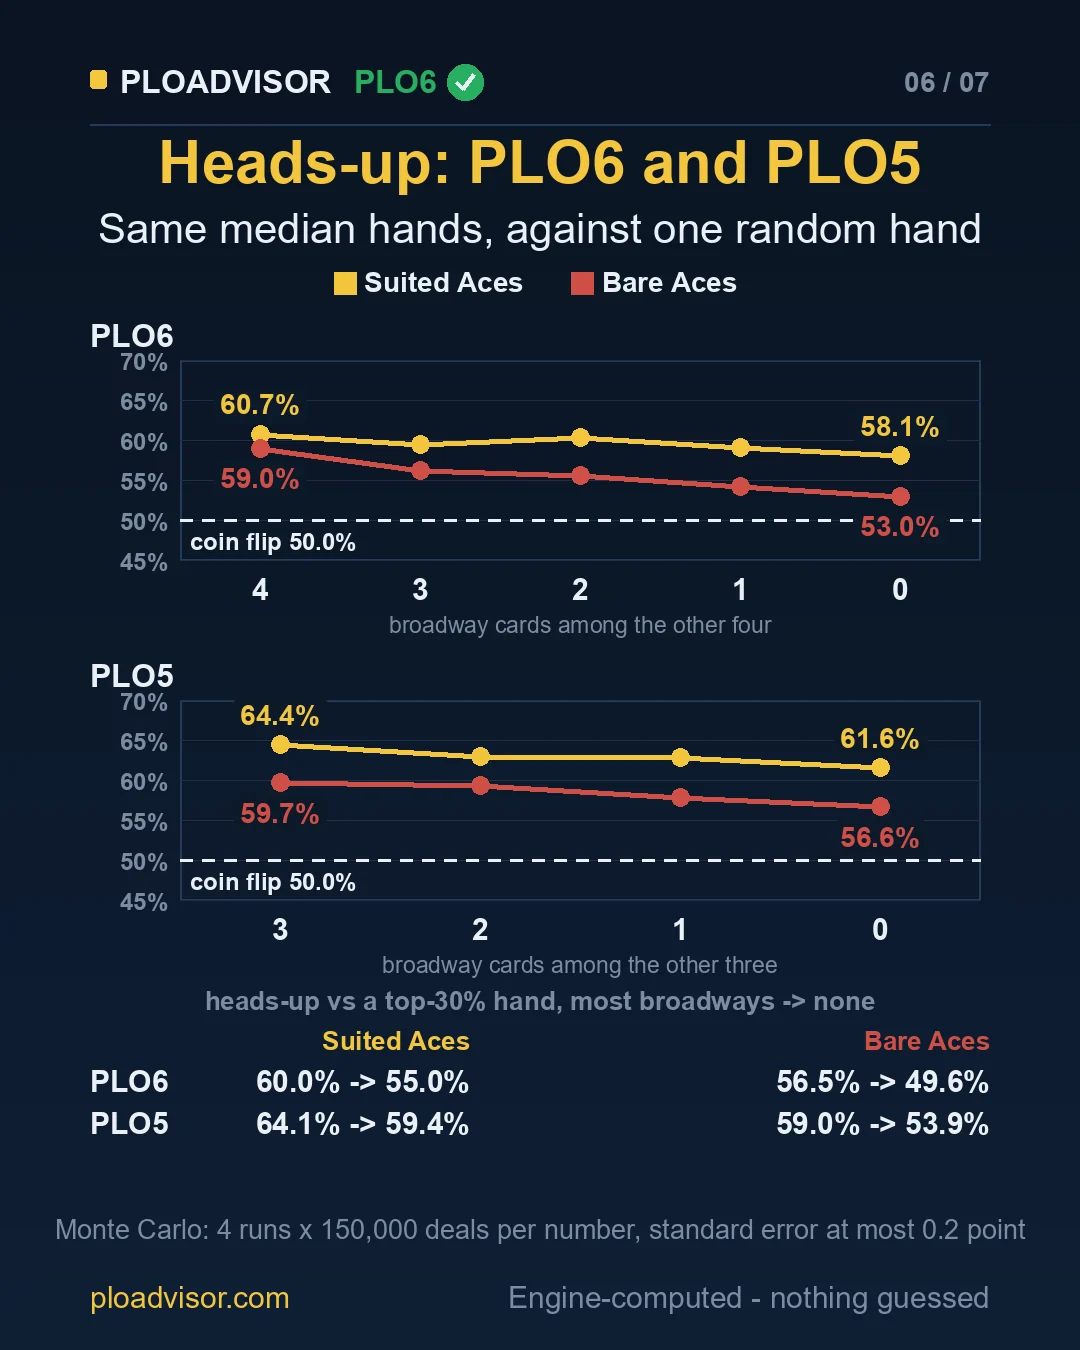
| Suited Aces, 4 broadways | (AKT)(AQ)J | 60.7% | 29.4% | 60.0% |
| Suited Aces, 3 broadways | (AK)(AT)K4 | 59.4% | 29.5% | 57.7% |
| Suited Aces, 2 broadways | (AQ8)(AJ)6 | 60.3% | 25.9% | 58.2% |
| Suited Aces, 1 broadway | (AT4)(A4)6 | 59.1% | 23.8% | 56.8% |
| Suited Aces, 0 broadways | (A7)(A5)(32) | 58.1% | 23.0% | 55.0% |
| Bare Aces, 4 broadways | (KT)(QT)AA | 59.0% | 26.4% | 56.5% |
| Bare Aces, 3 broadways | (KJ7)AAT | 56.2% | 21.9% | 54.3% |
| Bare Aces, 2 broadways | (K65)AAT | 55.5% | 19.9% | 52.6% |
| Bare Aces, 1 broadway | (K2)(74)AA | 54.2% | 17.8% | 50.4% |
| Bare Aces, 0 broadways | (953)AA8 | 53.0% | 16.0% | 49.6% |
The same interaction shows up. From four broadways to none, suited Aces drop from 29.4% to 23.0% in the bomb pot; bare Aces drop from 26.4% to 16.0% — below the 16.7% fair share. Against the top 30%, bare Aces with no broadway are at 49.6%: less than a coin flip.
Each equity is the median hand of the group, one concrete hand. A neighbouring hand of the same group can differ by a point or two, which is why the intermediate steps of the suited column are not perfectly smooth. The comparison that holds is the one at the two ends.
Heads-up: PLO6 and PLO5
The same question with a single opponent, in PLO6 and in PLO5. In PLO5 the Aces have three other cards, so the ladder runs from three broadways to none. Every one of these hands is still ahead of a random hand; against a top-30% hand, bare Aces with no broadway drop to 49.6% in PLO6.
| PLO5 group | Median hand | PLO5 ranking | Heads-up vs random | Heads-up vs top 30% |
|---|---|---|---|---|
| Suited Aces, 3 broadways | (AQJ)(AT) | Top 0.1% | 64.4% | 64.1% |
| Suited Aces, 2 broadways | (AQ8)(AQ) | Top 0.4% | 62.9% | 61.8% |
| Suited Aces, 1 broadway | (AK)(A9)6 | Top 0.7% | 62.9% | 61.6% |
| Suited Aces, 0 broadways | (A7)(A4)3 | Top 0.9% | 61.6% | 59.4% |
| Bare Aces, 3 broadways | AA(KT)K | Top 2.2% | 59.7% | 59.0% |
| Bare Aces, 2 broadways | AA(KT)6 | Top 4.0% | 59.4% | 57.9% |
| Bare Aces, 1 broadway | AA(Q5)3 | Top 6.5% | 57.8% | 55.3% |
| Bare Aces, 0 broadways | AA(753) | Top 10.4% | 56.6% | 53.9% |
A pair of Aces in PLO6 is not one hand. Suited Aces have something to fall back on when the broadways are missing; bare Aces do not — the broadway cards are most of what they have.
How these numbers were produced
- Exact: the grouping and the medians are counted over every hand, weighted by the number of concrete hands per class (the counts add up to all C(52,6) PLO6 hands, and the per-broadway totals match an independent combinatorial count).
- Simulated: the order of the ranking itself (our PLO6 playability ranking, 6-max — how we built it). Deeper in the ranking the estimates are less precise, which is why those medians are shown without decimals (Top 32%).
- Equity: Monte Carlo, 4 independent runs of 150,000 deals per number; standard error at most 0.2 point.